- VMware Technology Network
- :
- Cloud & SDDC
- :
- VMware Aria
- :
- VMware Aria Operations Discussions
- :
- Re: Trying to build a custom dashboard around stor...
- Subscribe to RSS Feed
- Mark Topic as New
- Mark Topic as Read
- Float this Topic for Current User
- Bookmark
- Subscribe
- Mute
- Printer Friendly Page
- Mark as New
- Bookmark
- Subscribe
- Mute
- Subscribe to RSS Feed
- Permalink
- Report Inappropriate Content
Trying to build a custom dashboard around storage
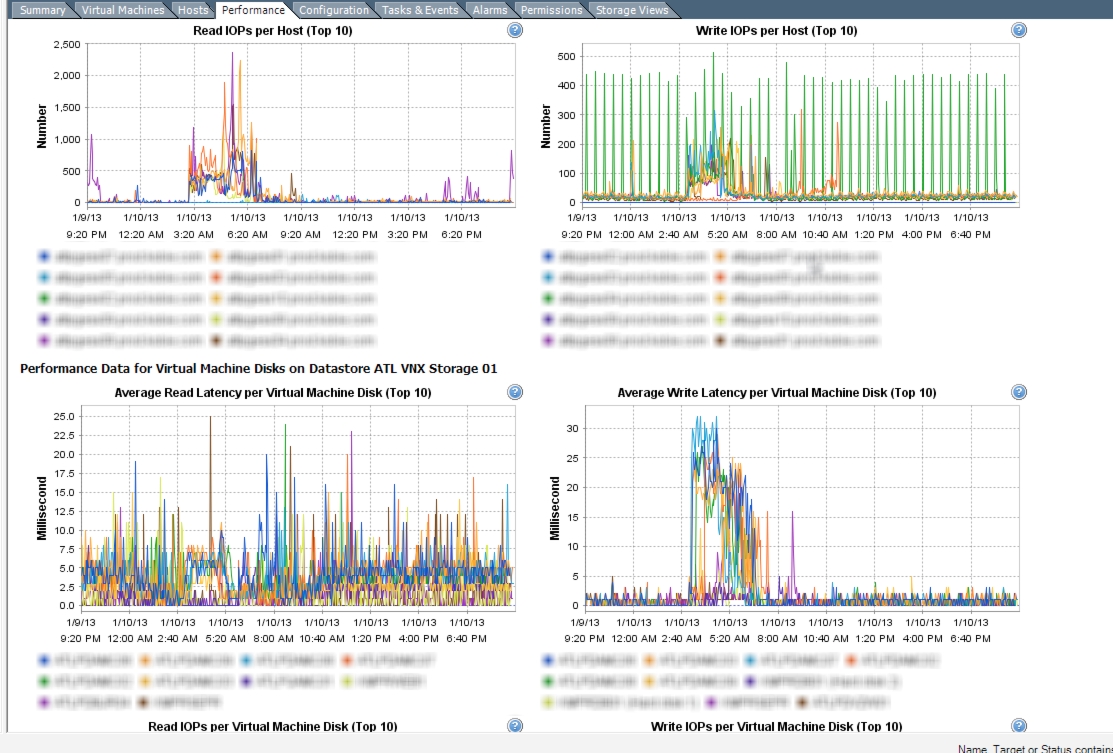
So I'm trying to duplicate a screen that my boss uses all the time within vCenter.
Often he uses the Datastores and Datastores Cluster view to look at the performance data of the datastore and each VM usage on that datastore.
is there any way I could build a dashboard like this using something other than heatmaps?
Sure people know the screen I'm talking about but just in case its attached to this post.
- Mark as New
- Bookmark
- Subscribe
- Mute
- Subscribe to RSS Feed
- Permalink
- Report Inappropriate Content
Yes that is possible.
You can create in the "vcops custom UI" a dashboard with all the things you want to monitor.
take a look here http://velemental.com/2012/04/12/tutorial-building-custom-dashboards-in-vcops/
- Mark as New
- Bookmark
- Subscribe
- Mute
- Subscribe to RSS Feed
- Permalink
- Report Inappropriate Content
- Mark as New
- Bookmark
- Subscribe
- Mute
- Subscribe to RSS Feed
- Permalink
- Report Inappropriate Content
So I should be able to use the Metric Graph and map hit the split graphs button.
What about the decisioning on what VM's show up, like in vCenter its picking what looks to be the top 10 VM's/Hosts
- Mark as New
- Bookmark
- Subscribe
- Mute
- Subscribe to RSS Feed
- Permalink
- Report Inappropriate Content
You can use the TopN Widget for this. You can select a Metric and it will show the top N of that metric.
In addition you can alos look at using Interactions. This is usefull when you have a Widget that "feeds" data to another. Thus you can select a VM on the one widget and it will then show more data/info/metrics on another widget.
Hugo
- Mark as New
- Bookmark
- Subscribe
- Mute
- Subscribe to RSS Feed
- Permalink
- Report Inappropriate Content
I will check out the TopN Widget. do you have an example?
I'm using the interactions now to graph VM data along with root cause rankings and thats working well.
I'm looking for something that I can select the Datastore resource, this feeds data into another widget that charts the top VM's hitting that datastore for a selected metric.
- Mark as New
- Bookmark
- Subscribe
- Mute
- Subscribe to RSS Feed
- Permalink
- Report Inappropriate Content
- Mark as New
- Bookmark
- Subscribe
- Mute
- Subscribe to RSS Feed
- Permalink
- Report Inappropriate Content
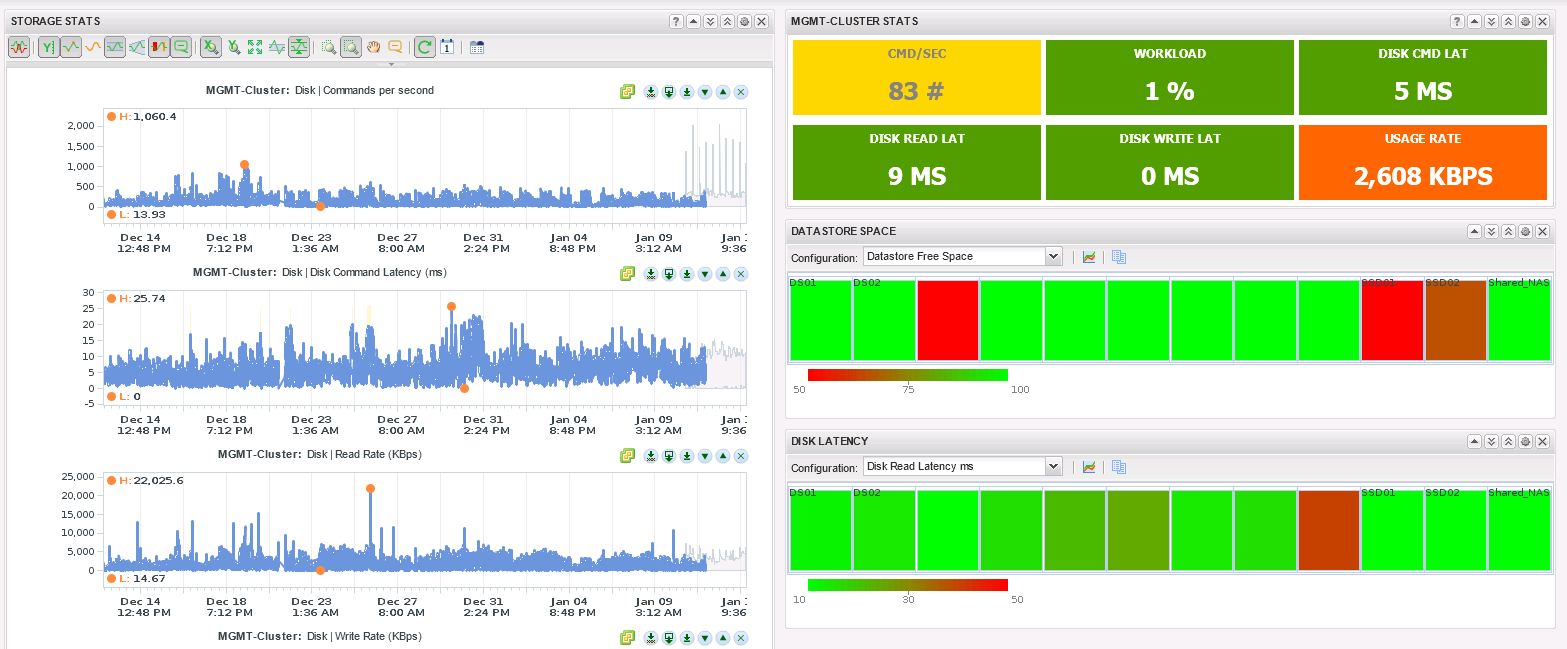
Hi,
could you post an example of your "mgmgt-Cluster-Stats" configuration (upper right) widget please.
THX a lot
Hank
- Mark as New
- Bookmark
- Subscribe
- Mute
- Subscribe to RSS Feed
- Permalink
- Report Inappropriate Content
Guess I just need to keep playing around, I dont think I can give the data in the same way that its presented in vCenter but hopefully I can come close.
- Mark as New
- Bookmark
- Subscribe
- Mute
- Subscribe to RSS Feed
- Permalink
- Report Inappropriate Content
Maybe this use case will help try to figure out this dashboard.
I have a datastore that all of a sudden is using 5 times the amount of disk i/o as all the others.
I can easily see what VM's that are on that datastore using the VC Relationship widget
What widgets could I use to select the datastore as a resource, then select a metric, then graphic that metric for all VM's on that datastore.