- VMware Technology Network
- :
- Cloud & SDDC
- :
- VMware Aria
- :
- VMware Aria Operations Discussions
- :
- Re: How can create custom alert list dashboard wit...
- Subscribe to RSS Feed
- Mark Topic as New
- Mark Topic as Read
- Float this Topic for Current User
- Bookmark
- Subscribe
- Mute
- Printer Friendly Page
- Mark as New
- Bookmark
- Subscribe
- Mute
- Subscribe to RSS Feed
- Permalink
- Report Inappropriate Content
How can create custom alert list dashboard with specific metrics for an object
Hi
Is that possible create a custom alert list dashboard with specific metrics.
For example want create a dashboard for alert list that can show object = "all virtual machines" just for Metrics "disk space usage / disk latency / CPU RDY"
BR
- Mark as New
- Bookmark
- Subscribe
- Mute
- Subscribe to RSS Feed
- Permalink
- Report Inappropriate Content
Actually need to create two dasboards :
One dashboards for monitoring groups that had to see some metrics and the other dashboard for Admin that need see all metrics for Troubleshoot and .....
- Mark as New
- Bookmark
- Subscribe
- Mute
- Subscribe to RSS Feed
- Permalink
- Report Inappropriate Content
Can anyone help me about that ?
- Mark as New
- Bookmark
- Subscribe
- Mute
- Subscribe to RSS Feed
- Permalink
- Report Inappropriate Content
Try this to get you started.
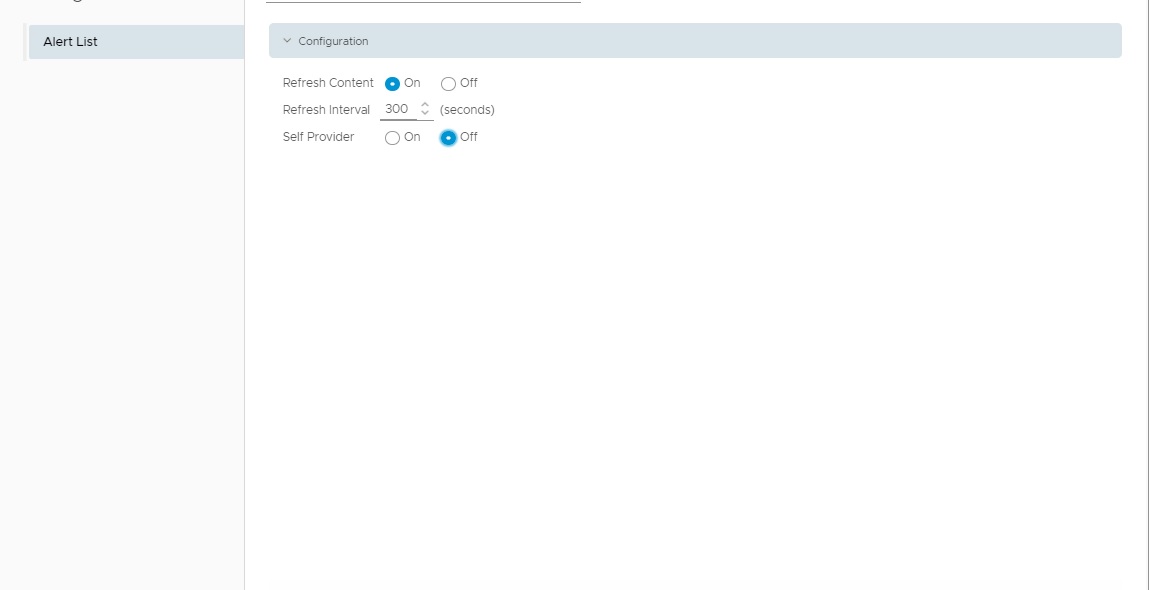
Create Dashboard, select Alert List.
Edit Widget
Under Output Filter, Basic, select Object Types.
Select Virtual Machines
This will give you alerts for all VMs.
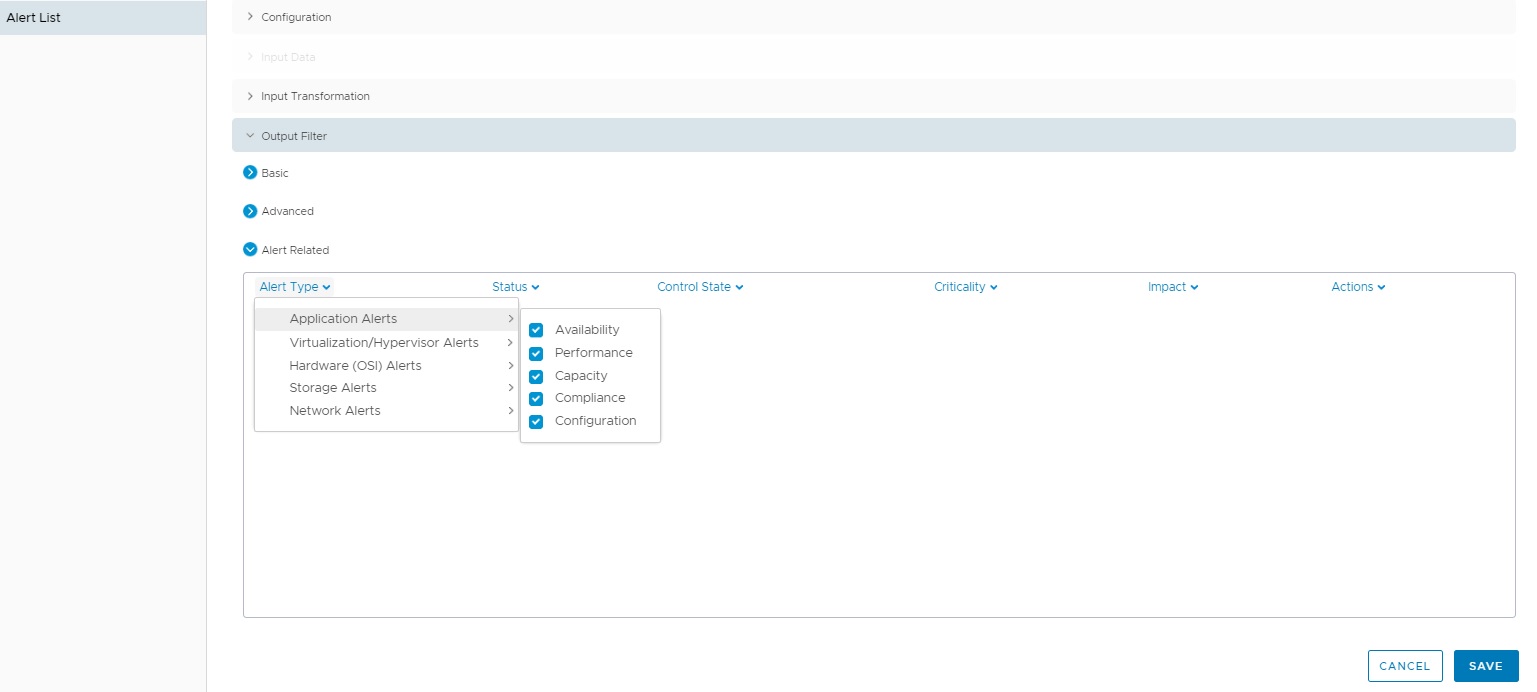
Then under the Advanced Section, you can filter by additional Object Type Info.
Also, under the Alert Related section, you can filter by Alert Type, Status, Criticality, etc. You may want to start here after you set the Basic settings.
- Mark as New
- Bookmark
- Subscribe
- Mute
- Subscribe to RSS Feed
- Permalink
- Report Inappropriate Content
Thanks
But as you can see attach pics there is not any option in alert related windows (pic 5) . Actually this is the main issue there is not any alarm here that can select for specific object
How can solve that ?
BR
- Mark as New
- Bookmark
- Subscribe
- Mute
- Subscribe to RSS Feed
- Permalink
- Report Inappropriate Content
So on pic 5, did you try and select the drop down and you had nothing listed?
- Mark as New
- Bookmark
- Subscribe
- Mute
- Subscribe to RSS Feed
- Permalink
- Report Inappropriate Content
What is your means from drop- down list there is nothing here according to pic5 why ?????
If your means is select alert list type according follow pic I have selected all of them but nothing change
- Mark as New
- Bookmark
- Subscribe
- Mute
- Subscribe to RSS Feed
- Permalink
- Report Inappropriate Content
When you selected Virtual Machine under Basic > Object Type, was there a number after it?
Ex. VIrtual Machine (225)
If there is a zero (0), try selecting other Object Types that have a number after them.
- Mark as New
- Bookmark
- Subscribe
- Mute
- Subscribe to RSS Feed
- Permalink
- Report Inappropriate Content
Thanks all
My problem solved. To do this had to use view widget instead of alert list .
BR