- VMware Technology Network
- :
- Cloud & SDDC
- :
- vSAN
- :
- VMware vSAN Discussions
- :
- vsan 6.2 write latency and read cache misses
- Subscribe to RSS Feed
- Mark Topic as New
- Mark Topic as Read
- Float this Topic for Current User
- Bookmark
- Subscribe
- Mute
- Printer Friendly Page
- Mark as New
- Bookmark
- Subscribe
- Mute
- Subscribe to RSS Feed
- Permalink
- Report Inappropriate Content
vsan 6.2 write latency and read cache misses
Since upgrading to vsan 6.2, I am seeing a major increase in read cache misses and write latency. Also, the physical disks show that the flash disks have 0 used capacity. This is a hybrid production environment. Does anyone have any thoughts on this?
- Mark as New
- Bookmark
- Subscribe
- Mute
- Subscribe to RSS Feed
- Permalink
- Report Inappropriate Content
- Mark as New
- Bookmark
- Subscribe
- Mute
- Subscribe to RSS Feed
- Permalink
- Report Inappropriate Content
The monitor tab under the cluster virtual san view used to show used capacity for the ssd's. Now it sits at zero. The may be expected behavior in the new version but I'm not sure. It's a 4 node cluster. I have done the on disk format upgrade on all disk groups. Whenever throughput goes up the latency jumps up pretty high.
- Mark as New
- Bookmark
- Subscribe
- Mute
- Subscribe to RSS Feed
- Permalink
- Report Inappropriate Content
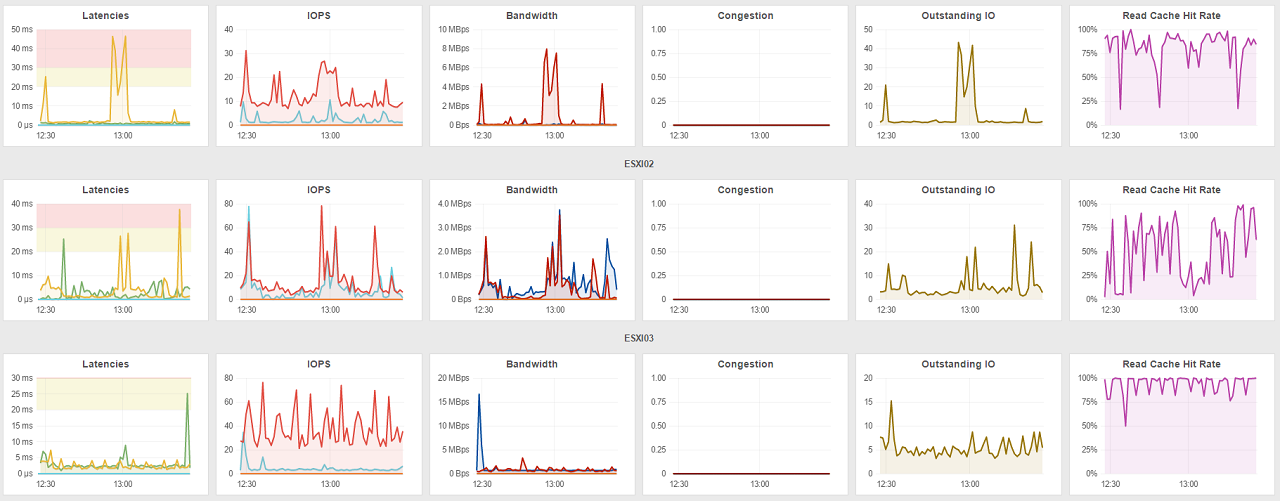
I noticed it too. I still use SexiGraf to look at the VSAN stats and in 6.1. I used to have a very high cache-hit ratio during the day. But now, in 6.2 and after the FS upgrade, it is much lower (on average) and "bounces" up and down a lot (spikey graphs so to say). It is not as stable / flat-lining as it used to be.
It's the same six nodes and the same VM's. I'm not sure what to make of it.
- Mark as New
- Bookmark
- Subscribe
- Mute
- Subscribe to RSS Feed
- Permalink
- Report Inappropriate Content
Good afternoon, nice tip on SexiGraf, which lead me to SexiLog. Getting a bit off topic, but do you know a good repository for documentation for them? I can't seem to find how to do something basic like change the web admin password. Thank you, Zach.
- Mark as New
- Bookmark
- Subscribe
- Mute
- Subscribe to RSS Feed
- Permalink
- Report Inappropriate Content
- Mark as New
- Bookmark
- Subscribe
- Mute
- Subscribe to RSS Feed
- Permalink
- Report Inappropriate Content
Yes, that is what i was looking for. Thank you!
- Mark as New
- Bookmark
- Subscribe
- Mute
- Subscribe to RSS Feed
- Permalink
- Report Inappropriate Content
have you reported this issue?
- Mark as New
- Bookmark
- Subscribe
- Mute
- Subscribe to RSS Feed
- Permalink
- Report Inappropriate Content
Hi Duncan,
No I haven't. In all honestly, I have not perceived it as an issue (yet) as performance is still good. It's just something I noticed.
If you look at the General Overview" screenshot, it is what my environment looks like since the 6.2 / FS3 upgrade. In 6.0 and 6.1, all hosts where much more like node ESX02 is now in this screenshots. All nodes where more or less flat-lining all between 70 and 100%.
The only moments that it looked as "spikey" as they do now, was when the nightly backups ran. Then the read-caches obviously get filled with the data from the spindles, pushing the static "during the day" data out. Then, typically a couple of hours after the backup, the caches stabilized and things returned to "just chugging along" the rest of the day.
Since the upgrade, it looks like backups are running all day long... ![]() Thing is, that the SSD's hardly see any evictions (second screenshot shows the SSD stats) so why is the cache-miss ratio so bad. Am i missing something?
Thing is, that the SSD's hardly see any evictions (second screenshot shows the SSD stats) so why is the cache-miss ratio so bad. Am i missing something?
- Mark as New
- Bookmark
- Subscribe
- Mute
- Subscribe to RSS Feed
- Permalink
- Report Inappropriate Content
I have noticed this in our enviroment also.
I changed the policy
* stripes : 2
* read cache : 10% ( on heavely used machines )
And now the read cache is always between 100% and 90%
- Mark as New
- Bookmark
- Subscribe
- Mute
- Subscribe to RSS Feed
- Permalink
- Report Inappropriate Content
- Mark as New
- Bookmark
- Subscribe
- Mute
- Subscribe to RSS Feed
- Permalink
- Report Inappropriate Content
Just one thing to point out, there is also a small memory read cache on the host where the VM resides as of 6.2 (client cache), so it could be that that is why the "Read Cache" is reporting a lower ratio but you are still seeing good performance. The current performance views do not show this cache layer yet, this is being worked on. The question here is if you are seeing much lower IOPS and higher latency than normal.
- Mark as New
- Bookmark
- Subscribe
- Mute
- Subscribe to RSS Feed
- Permalink
- Report Inappropriate Content