- VMware Technology Network
- :
- Cloud & SDDC
- :
- VMware Aria
- :
- VMware Aria Operations Discussions
- :
- Re: vCOps 5.6 locks up after extended period of ti...
- Subscribe to RSS Feed
- Mark Topic as New
- Mark Topic as Read
- Float this Topic for Current User
- Bookmark
- Subscribe
- Mute
- Printer Friendly Page
- Mark as New
- Bookmark
- Subscribe
- Mute
- Subscribe to RSS Feed
- Permalink
- Report Inappropriate Content
So I've had this issue back since vCOps 5.0, every update I hope it gets fixed but it doesn't. I've also had an SR open since July and while a lot of troubleshooting has been done we are still no where near a solution.
Seems like after leaving a custom dashboard containing the skittles view, six rolling metric graphs, heatmap, and a metric sparklines up for an extended period of time the CPU usage will gradually shoot up to 100% usage after a couple of hours.
We have tried adding additional CPU, Memory to both VM's. Seems to help but the end result is still a crash of the dashboard.
Has anyone seen this before?
Accepted Solutions
- Mark as New
- Bookmark
- Subscribe
- Mute
- Subscribe to RSS Feed
- Permalink
- Report Inappropriate Content
@ChaseHansen - I've send you private message.
- Mark as New
- Bookmark
- Subscribe
- Mute
- Subscribe to RSS Feed
- Permalink
- Report Inappropriate Content
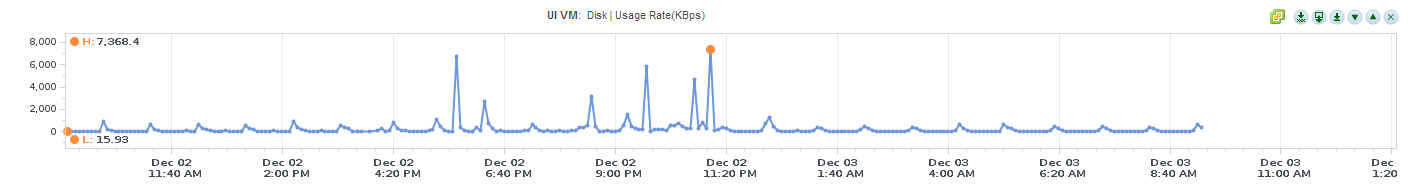
Can you post you UI vm disk stats also please ?
- Mark as New
- Bookmark
- Subscribe
- Mute
- Subscribe to RSS Feed
- Permalink
- Report Inappropriate Content
@ChaseHansen - what about memory usage?
do you see OOM errors in tomcat's logfiles (web.log) ?
- Mark as New
- Bookmark
- Subscribe
- Mute
- Subscribe to RSS Feed
- Permalink
- Report Inappropriate Content
- Mark as New
- Bookmark
- Subscribe
- Mute
- Subscribe to RSS Feed
- Permalink
- Report Inappropriate Content
it is in "/data/vcops/log" on the UI_VM
- Mark as New
- Bookmark
- Subscribe
- Mute
- Subscribe to RSS Feed
- Permalink
- Report Inappropriate Content
- Mark as New
- Bookmark
- Subscribe
- Mute
- Subscribe to RSS Feed
- Permalink
- Report Inappropriate Content
- Mark as New
- Bookmark
- Subscribe
- Mute
- Subscribe to RSS Feed
- Permalink
- Report Inappropriate Content
okay, thanks - I've passed all that information to the engineering team.
- Mark as New
- Bookmark
- Subscribe
- Mute
- Subscribe to RSS Feed
- Permalink
- Report Inappropriate Content
@ChaseHansen - I've send you private message.
- Mark as New
- Bookmark
- Subscribe
- Mute
- Subscribe to RSS Feed
- Permalink
- Report Inappropriate Content
Thank you gradinka, the patch provided by my SR owner fixed the issue. Dashboard has been running for over 24 hours and still as quick as ever.
I'm thrilled!