- VMware Technology Network
- :
- Cloud & SDDC
- :
- vCenter
- :
- vCenter™ Server Discussions
- :
- Print out the VC Performance Overview Report
- Subscribe to RSS Feed
- Mark Topic as New
- Mark Topic as Read
- Float this Topic for Current User
- Bookmark
- Subscribe
- Mute
- Printer Friendly Page
- Mark as New
- Bookmark
- Subscribe
- Mute
- Subscribe to RSS Feed
- Permalink
- Report Inappropriate Content
Print out the VC Performance Overview Report
Hi Everyone -
Is there a way to print out the VC (4.1u1) Performance Overview report with graphs? The overview report gives me the environment in a nutshell w/o no customization and that is exactly what I am looking for for my weekly vSphere report. Thanks for the info.
- Mark as New
- Bookmark
- Subscribe
- Mute
- Subscribe to RSS Feed
- Permalink
- Report Inappropriate Content
you can get some 3rd party agents installed on VC like Veeam reporter etc.. to get customised reports and you can also print them...
- Mark as New
- Bookmark
- Subscribe
- Mute
- Subscribe to RSS Feed
- Permalink
- Report Inappropriate Content
Thanks, I know I can purchase add-ons however I was hoping to do this w/o purchasing third party sofware.
- Mark as New
- Bookmark
- Subscribe
- Mute
- Subscribe to RSS Feed
- Permalink
- Report Inappropriate Content
You can generate custom graph and export them in the advanced tab.
Unfortunally not in the overview one.
Andre
- Mark as New
- Bookmark
- Subscribe
- Mute
- Subscribe to RSS Feed
- Permalink
- Report Inappropriate Content
Hi,
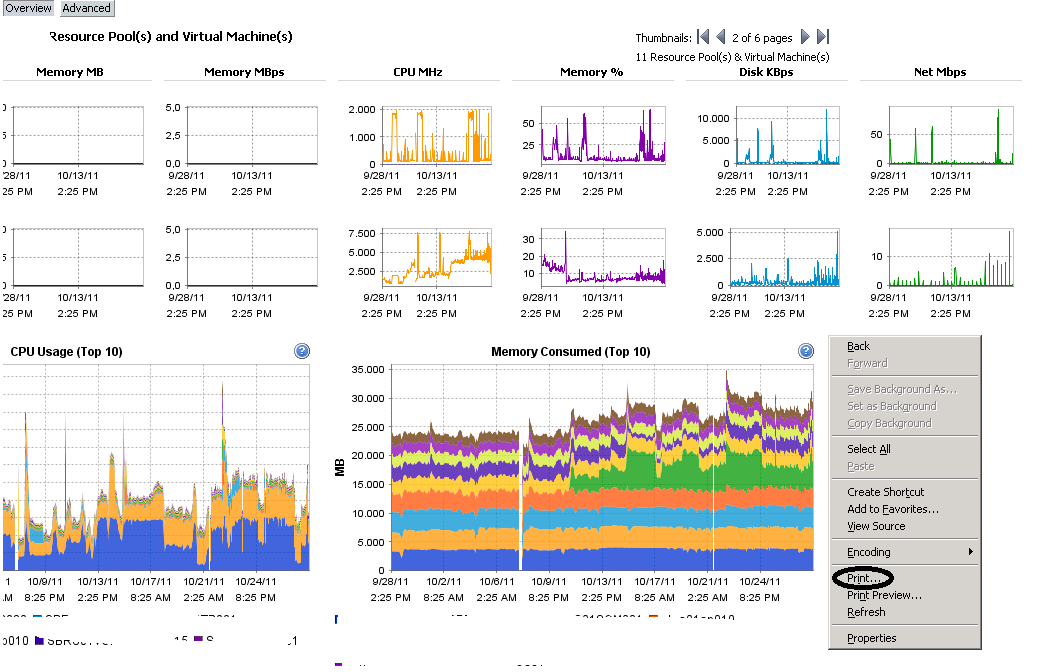
There is a hidden spot where you can right click and print this chart. LoL!! but you have to find that right click option. I managed to find it for host overview and resource pool overview chart.
You can then print to pdf or .xps and can save the file in HTML or PDF. At the moment this is the only option ![]() .
.
Do reply me, if you manage to find the right click option This is not a solution however indeed a workaround ![]() .
.
You can also copy that hyperlink and copy into internet explorer. And then can do the modifications.
You can use custom time range too.
And dont forget to reply me if you can find that hidden right click:smileymischief: