Turn on suggestions
Auto-suggest helps you quickly narrow down your search results by suggesting possible matches as you type.
Showing results for
- VMware Technology Network
- :
- Cloud & SDDC
- :
- vCenter
- :
- vCenter Hyperic Discussions
- :
- worng Traffic data ? (Bits Transmitted Chart)
VMware Cloud Community
Options
- Subscribe to RSS Feed
- Mark Topic as New
- Mark Topic as Read
- Float this Topic for Current User
- Bookmark
- Subscribe
- Mute
- Printer Friendly Page
- Mark as New
- Bookmark
- Subscribe
- Mute
- Subscribe to RSS Feed
- Permalink
- Report Inappropriate Content
worng Traffic data ? (Bits Transmitted Chart)
Hey guys,
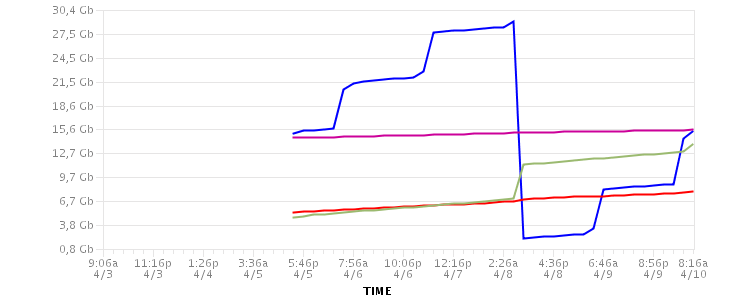
i have attached a picture from my Traffic Monitoring on a Firewall. Normaly these values increase, they don't drop. The Blue Graph is droping down to 0,8 GB.
Where should i search for this problem? Agent, Server, or is this maybe a Debian problem?
Thanks
Maximilian Mill
i have attached a picture from my Traffic Monitoring on a Firewall. Normaly these values increase, they don't drop. The Blue Graph is droping down to 0,8 GB.
Where should i search for this problem? Agent, Server, or is this maybe a Debian problem?
Thanks
Maximilian Mill
6 Replies
- Mark as New
- Bookmark
- Subscribe
- Mute
- Subscribe to RSS Feed
- Permalink
- Report Inappropriate Content
- Mark as New
- Bookmark
- Subscribe
- Mute
- Subscribe to RSS Feed
- Permalink
- Report Inappropriate Content
What is the resource type here (in HQ)? Linux Platform interface? Network Device?
Maybe the device resets that counter, possibly after a reboot or server restart?
Maybe the device resets that counter, possibly after a reboot or server restart?
- Mark as New
- Bookmark
- Subscribe
- Mute
- Subscribe to RSS Feed
- Permalink
- Report Inappropriate Content
Hey John,
its monitored with the NetworkServer Interface dialog. I attach a new picture with description. As you see eth3 is going crazy. Its a Intel 1000Gbit Desktopcard. The other cards are 3com 100mibt :3c59x .
A reboot or restart cant be the problem. Uptime is 22 days. Any one suggestions?
Thanks
its monitored with the NetworkServer Interface dialog. I attach a new picture with description. As you see eth3 is going crazy. Its a Intel 1000Gbit Desktopcard. The other cards are 3com 100mibt :3c59x .
A reboot or restart cant be the problem. Uptime is 22 days. Any one suggestions?
Thanks
- Mark as New
- Bookmark
- Subscribe
- Mute
- Subscribe to RSS Feed
- Permalink
- Report Inappropriate Content
I watched the docs at :http://www.hyperic.com/support/docs/sigar/
It looks how i though it would be. The agent gets only one value about tx/rx http://www.hyperic.com/support/docs/sigar/org/hyperic/sigar/NetInterfaceStat.html#getRxBytes()
After that the hyperic Server calculates the "overall Bits Received"
So this looks like a bug or am i worng?
It looks how i though it would be. The agent gets only one value about tx/rx http://www.hyperic.com/support/docs/sigar/org/hyperic/sigar/NetInterfaceStat.html#getRxBytes()
After that the hyperic Server calculates the "overall Bits Received"
So this looks like a bug or am i worng?
- Mark as New
- Bookmark
- Subscribe
- Mute
- Subscribe to RSS Feed
- Permalink
- Report Inappropriate Content
- Mark as New
- Bookmark
- Subscribe
- Mute
- Subscribe to RSS Feed
- Permalink
- Report Inappropriate Content
can anybody move this to the BUGS forum? Thanks!