Turn on suggestions
Auto-suggest helps you quickly narrow down your search results by suggesting possible matches as you type.
Showing results for
- VMware Technology Network
- :
- Cloud & SDDC
- :
- vCenter
- :
- vCenter Hyperic Discussions
- :
- Re: Custom Mbeans are not getting discovered.
VMware Cloud Community
Options
- Subscribe to RSS Feed
- Mark Topic as New
- Mark Topic as Read
- Float this Topic for Current User
- Bookmark
- Subscribe
- Mute
- Printer Friendly Page
- Mark as New
- Bookmark
- Subscribe
- Mute
- Subscribe to RSS Feed
- Permalink
- Report Inappropriate Content
Custom Mbeans are not getting discovered.
Hi All,
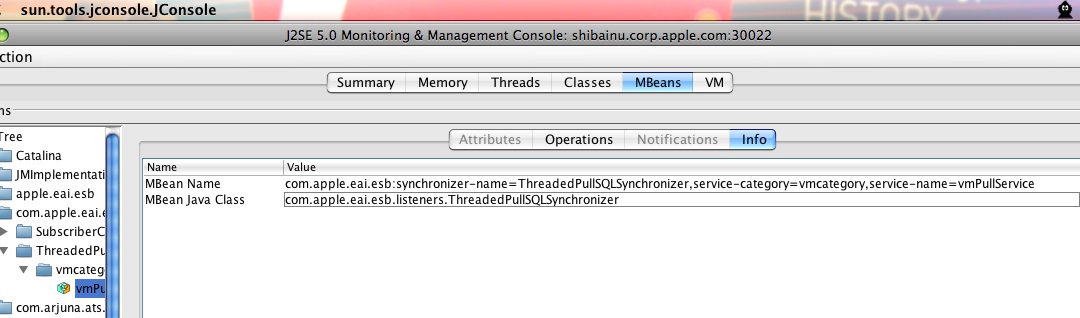
I have written some basic plugins to discover my application specific mbeans. I can able to discover those mbeans using jconsole. Attached the screenshot (15-Feb-Jconsole.jpg).
mbean name :com.apple.eai.esb:synchronizer-name=ThreadedPullSQLSynchronizer,service-category=vmcategory,service-name=vmPullService
Content of the plugin :
<plugin name="test-esb" package="org.hyperic.hq.product.jmx">
<service name="Elango1" server="Sun JVM" version="1.5">
<config>
<option name="jmx.url" description="JMX URL to MBeanServer" default="service:jmx:rmi:///jndi/rmi://shibainu.corp.apple.com:30022/jmxrmi"/>
<option name="jmx.username" description="JMX username" optional="true" default=""/>
<option name="jmx.password" description="JMX password" optional="true" default="" type="secret"/>
</config>
<property name="OBJECT_NAME" value="com.apple.eai.esb:synchronizer-name=ThreadedPullSQLSynchronizer,service-category=vmcategory,service-name=vmPullService"/>
<plugin type="autoinventory" class="org.hyperic.hq.product.jmx.MxServerDetector"/>
<plugin type="measurement" class="org.hyperic.hq.product.jmx.MxMeasurementPlugin"/>
<plugin type="control" class="org.hyperic.hq.product.jmx.MxControlPlugin"/>
<metric name="Availability"
template="${OBJECT_NAME}:Available"
indicator="true"/>
<metric name="Used Memory"
template="${OBJECT_NAME}:Composite.Usage.used"
indicator="true"
units="B"/>
<metric name="Commited Memory"
template="${OBJECT_NAME}:Composite.Usage.committed"
indicator="true"
units="B"/>
<metric name="Status"
category="PERFORMANCE"
template="${OBJECT_NAME}:Status"
indicator="true"/>
</service>
</plugin>
It compiled fine. And when i executed the below command in Agent directory ,
java -jar pdk/lib/hq-product.jar -Dplugins.include=test-esb -m discover -a metric -Dlog=debug
None of servers are getting detected. Please refer the log i got :
[DEBUG] ProductPluginManager - Initializing in client mode (pdk=/Volumes/ngs/app/xt01t/Hyperic/hyperic-hq-agent-3.2.0/pdk)
[DEBUG] MIBTree - No MIBs in directory: /Volumes/ngs/app/xt01t/Hyperic/hyperic-hq-agent-3.2.0/pdk/mibs
[INFO] ProductPluginManager - Loading plugin: system-plugin.jar
[DEBUG] SystemPlugin - sigar.mirror.procnet=null
[INFO] ProductPluginManager - Loading plugin: netservices-plugin.jar
[INFO] MeasurementPlugin - Register TCP Socket proxy for domain: socket
[INFO] MeasurementPlugin - Register HTTP proxy for domain: http
[INFO] MeasurementPlugin - Register HTTP proxy for domain: url.availability
[INFO] MeasurementPlugin - Register FTP proxy for domain: ftp
[INFO] ProductPluginManager - Loading plugin: sqlquery-plugin.jar
[DEBUG] ProductPluginManager - adding to sqlquery classpath:
[DEBUG] ProductPluginManager - d /Volumes/ngs/app/xt01t/Hyperic/hyperic-hq-agent-3.2.0/pdk/lib/jdbc
[INFO] SQLQueryMeasurementPlugin - Registered proxy for domain: sql
[INFO] ProductPluginManager - Loading plugin: test-esb-plugin.xml
[DEBUG] ProductPluginManager - adding to test-esb classpath:
[DEBUG] ProductPluginManager - d /Volumes/ngs/app/xt01t/Hyperic/hyperic-hq-agent-3.2.0/pdk/lib/mx4j
[DEBUG] PluginDiscoverer - Adding Auto Scanners=[]
[WARN] Scanner - No server signatures were found.
0 servers detected
In the Hyperic web interface , it is displaying the services name. But when i try to get the metrics , i'm getting error. Attached the error screenshot (15-Feb-Hyperic.jpg)
Please let me know where i went wrong. Please let me know how to resolve this issue.
Thanks in Advance.
Elangovan.
2 Replies
- Mark as New
- Bookmark
- Subscribe
- Mute
- Subscribe to RSS Feed
- Permalink
- Report Inappropriate Content
Hi,
Regarding the auto-discovery, please refer to this thread and the doc link within:
http://communities.vmware.com/message/1919666#1919666
You'll also need to change your plugins.include filter to include the jmx plugin:
-Dplugins.include=jmx,test-esb
As for the AttributeNotFoundException, this is expected based on your jconsole screenshot. The attributes tab is grey'd out, indicating this MBean does not have any attributes.
You'll also need to change the attribute name here from "Available" to "Availability":
<metric name="Availability"
template="${OBJECT_NAME}:Availability"
indicator="true"/>
This is a special case for the Availability metric, where the jmx plugin will return 1 (green light in the UI) provided the MBean itself exists.
I can see from the jconsole your MBean has operations, which can be exposed as control actions in HQ. You'll need to define which operations should be exposed like so:
<actions include="OperationName1,OperationName2"/>
- Mark as New
- Bookmark
- Subscribe
- Mute
- Subscribe to RSS Feed
- Permalink
- Report Inappropriate Content
Also, you can remove this section since these properties are inherited from the "Sun JVM 1.5" server type you're attaching the service to:
<config>
<option name="jmx.url" description="JMX URL to MBeanServer" default="service:jmx:rmi:///jndi/rmi://shibainu.corp.apple.com:30022/jmxrmi"/>
<option name="jmx.username" description="JMX username" optional="true" default=""/>
<option name="jmx.password" description="JMX password" optional="true" default="" type="secret"/>
</config>
And, change this line:
<plugin type="autoinventory" class="org.hyperic.hq.product.jmx.MxServerDetector"/>
to:
<plugin type="autoinventory"/>
The MxServerDetector is used to detect the server process.
Services just need the OBJECT_NAME property and <plugin type="autoinventory"/> for auto-discovery.