- VMware Technology Network
- :
- Cloud & SDDC
- :
- vSAN
- :
- VMware vSAN Discussions
- :
- Re: vSAN Observer not showing graphs
- Subscribe to RSS Feed
- Mark Topic as New
- Mark Topic as Read
- Float this Topic for Current User
- Bookmark
- Subscribe
- Mute
- Printer Friendly Page
- Mark as New
- Bookmark
- Subscribe
- Mute
- Subscribe to RSS Feed
- Permalink
- Report Inappropriate Content
vSAN Observer not showing graphs
I am having an issue with vSAN Observer.
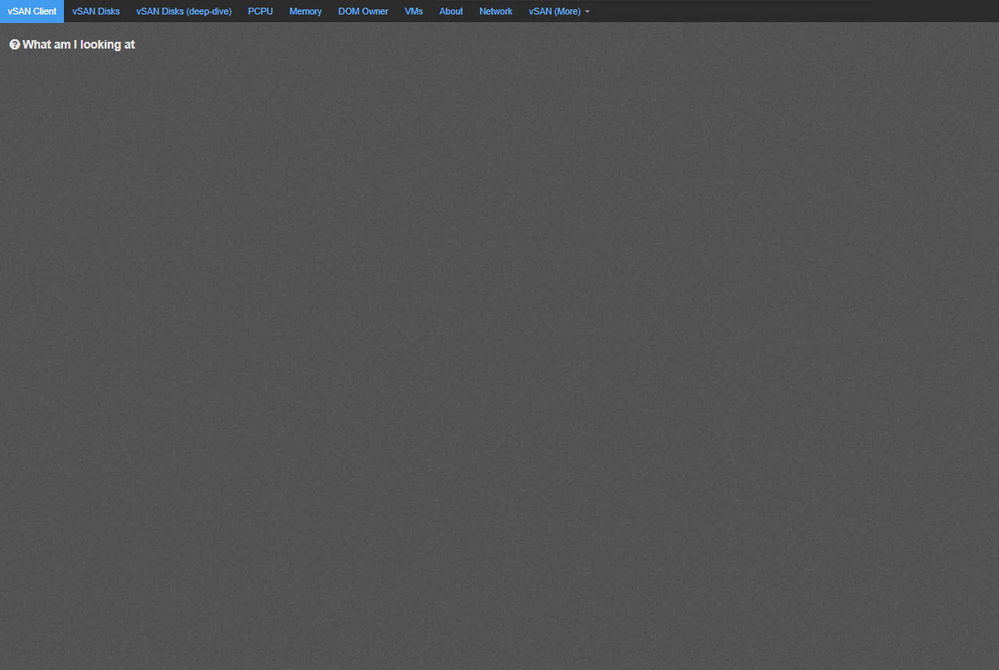
Starting the service using this command: "vsan.observer . --force --run-webserver" I can´t see any information on the website.
The tabs are blank and not brings any information, except the about one, which shows info about my host's models and hardware.
In the logs, while the command is running I can´t see any error, and I have checked out there is no proxy between the terminal server where I am browsing the website using chrome. Even the TS has an IP address in the same network as vCenter.
I can see in the logs: Query VM properties: 16.27 sec (3243 VMs), so the information is there but is not showed at all.
I will attach an image to show how I see the web.
Thanks!
- Mark as New
- Bookmark
- Subscribe
- Mute
- Subscribe to RSS Feed
- Permalink
- Report Inappropriate Content
Hi,
I might be wrong, but vSAN Observer seems to be deprecated
Instead you could see the graphs directly in the vCenter WebClient under vSAN, Support, Performance for Support.
Hope this helps a bit.
Greetings from Germany. (CEST)
- Mark as New
- Bookmark
- Subscribe
- Mute
- Subscribe to RSS Feed
- Permalink
- Report Inappropriate Content
There is also the vSAN Performance Monitor fling that is worth a look at...

