- VMware Technology Network
- :
- Cloud & SDDC
- :
- Automation
- :
- VMware PowerCLI Discussions
- :
- I need to capture -Realtime stats of 6 VM's every ...
- Subscribe to RSS Feed
- Mark Topic as New
- Mark Topic as Read
- Float this Topic for Current User
- Bookmark
- Subscribe
- Mute
- Printer Friendly Page
- Mark as New
- Bookmark
- Subscribe
- Mute
- Subscribe to RSS Feed
- Permalink
- Report Inappropriate Content
Hello VMware Community,
I learned that not every VM has the same Statistics available to aggregate.
When I run Get-StatType -Entity "VM-Name" the command returns all stats available. I have copied them and pasted them into excel (sort them so they are descending) and the 5 VMs have different StatTypes available.
All VM''s are vmx13/v13, four of them are built from the same template and only 3 of those have all the same StatTypes, 1 Winodws vm is different and the 1 Linux vm is different than the others.
So, I went thru them all and found common StatTypes to meet my requirements.
I found the code below and have worked on it for a few days to modify it for my requirements.
Objective of this script is to run every hour, 24hrs a day, via a windows task.
There is a variable $fileName that it generates a new file for each VM listed in a csv file it references, it generates a filename with vmname and the date. It should append every hour and at 12midnight when it runs generate a new file with the vm name and the new date. Currently it does not append since it isnt using the Export-CSV function.
Some of the code is grey in notepad++ but I cannot seem to find the offending code that is offsetting everything below. **I have attached a screenshot of this behavior if it helps.
I would like this file to append to the csv file every time it runs but fails when I comment out the $fileName line at the top of the script and add below where $fileName is located with " | Export-Csv -Path "/home/<file_directory>/$server-$(get-date -f yyyy-MM-dd).csv" -Append"
I would like to also capture but cannot seem to find details on how to, i dont know if there would be an array, etc. I'm not a coder but took a few coding classes in college so I can follow what the code is doing.
-Allocated Memory (MB or GB)
-Num CPU's allocated (1,2,3,4 etc)
-CPU Clock Speed per CPU (x.xGhz)
-CPU min/max, I have AVG already
-Total memory allocated
-Memory min/max, I have AVG already
-VM disk IOPs
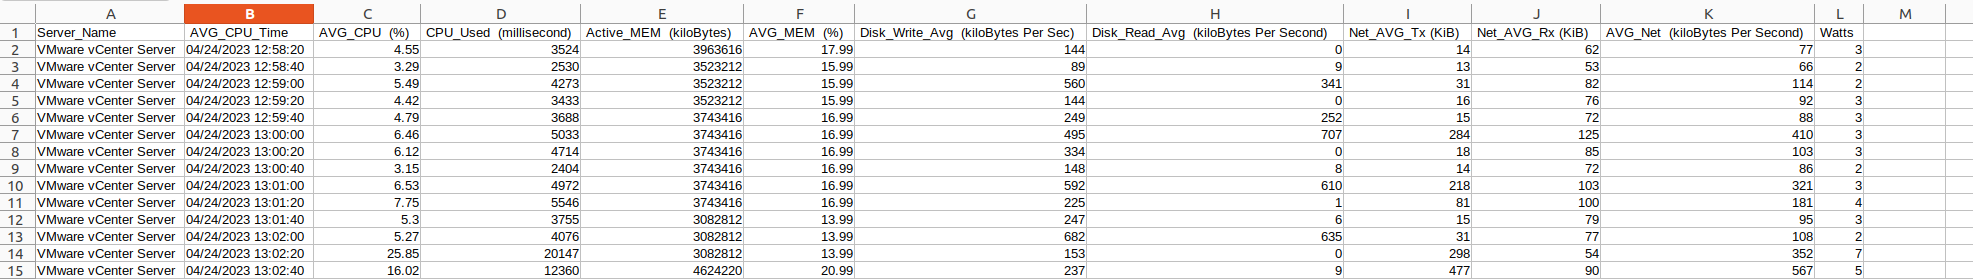
Can I round to the nearest whole number or extend like 6 decimal places for more accuracy? Every returned value for mem.usage.average ends in .99 (like 2.99, or 4.99, no whole numbers)
The power.power.average has lots of zeros or low numbers like 1,2,3, which is strange because zero watts for a running VM?
(metal server is using 110-140 Watts)
I posted an example of my old script that didn't really work well or capture what I needed it to about 2-3 weeks ago and @LucD replied with a suggestion, but then the boss changed the requirements last Wednesday..
Can someone help me like (@Lucd) to tweak this code to do what i need it to do?
Thank you so very much in advance,
Stephen
~~~~~~~~~~~~~~~~~~~~~~~~~~~~~~~~~~~~~~~~~~~~~~~~~~~~~~~~~~~~~~~~~~~~~~~~~~~~~~~~~~~~~~~~~~~~~~~~~~~~~~~~~~~~~~
Connect-VIServer -Server '#####IP ADDR#####' -Protocol https -User "administrator@vsphere.local" -Password '#####PASS#####'
#only return VM's I specify
$servers=Get-Content /home/'####PATH######'/vms_SH50.csv #vm names in vmware server
foreach ($server in $servers)
{
$vm=Get-VM $server
if($? -eq $false)
{
continue
}
$fileName="/home/'#####PATH#####'/$server-$(get-date -f yyyy-MM-dd).csv"
$virtualdiskwriteAVG=Get-Stat -entity $vm -MaxSamples 180 -Realtime -stat ‘virtualDisk.write.average’ | ? { $_.instance -eq "" } | select Entity,Timestamp,Value | Sort-Object Timestamp
$virtualdiskreadAVG=Get-Stat -entity $vm -MaxSamples 180 -Realtime -stat ‘virtualDisk.read.average’ | ? { $_.instance -eq "" } | select Entity,Timestamp,Value | Sort-Object Timestamp
$networkbytesRXAVG=Get-Stat -entity $vm -MaxSamples 180 -Realtime -stat 'net.bytesRx.average' | ? { $_.instance -eq "" } | select Entity,Timestamp,Value | Sort-Object Timestamp
$networkbytesTXAVG=Get-Stat -entity $vm -MaxSamples 180 -Realtime -stat ‘net.bytesTx.average' | ? { $_.instance -eq "" } | select Entity,Timestamp,Value | Sort-Object Timestamp
$networkAVG=Get-Stat -entity $vm -MaxSamples 180 -Realtime -stat 'net.usage.average' | ? { $_.instance -eq "" } | select Entity,Timestamp,Value | Sort-Object Timestamp
$powerusageAVG=Get-Stat -entity $vm -MaxSamples 180 -Realtime -stat ‘power.power.average’ | ? { $_.instance -eq "" } | select Entity,Timestamp,Value | Sort-Object Timestamp
$memactiveAVG=Get-Stat -entity $vm -MaxSamples 180 -Realtime -stat ‘mem.active.average’ | ? { $_.instance -eq "" } | select Entity,Timestamp,Value | Sort-Object Timestamp
$CPUsummation=Get-Stat -entity $vm -MaxSamples 180 -Realtime -stat ‘cpu.used.summation’ | ? { $_.instance -eq "" } | select Entity,Timestamp,Value | Sort-Object Timestamp
$CPUAVG=Get-Stat -entity $vm -MaxSamples 180 -Realtime -stat ‘cpu.usage.average’ | ? { $_.instance -eq "" } | select Entity,Timestamp,Value | Sort-Object Timestamp
$memusageaverage=Get-Stat -entity $vm -MaxSamples 180 -Realtime -stat ‘mem.usage.average’ | ? { $_.instance -eq "" } | select Entity,Timestamp,Value | Sort-Object Timestamp
Set-Content -Value "Server_Name , AVG_CPU_Time , AVG_CPU (%) , CPU_Used (millisecond), Active_MEM (kiloBytes) , AVG_MEM (%) , Disk_Write_Avg (kiloBytes Per Sec) , Disk_Read_Avg (kiloBytes Per Second) , Net_AVG_Tx (KiB) , Net_AVG_Rx (KiB) , AVG_Net (kiloBytes Per Second) , Watts" -Path $fileName
$diskus=0
for ($i=0;$i -lt $CPUAVG.Count ; $i++)
{
if (($diskus -lt $virtualdiskwriteAVG.count) -and ($CPUAVG[$i].Timestamp -eq $virtualdiskwriteAVG[$diskus].Timestamp))
{
Add-Content -Value "$($CPUAVG[$i].Entity.Name),$($CPUAVG[$i].Timestamp),$($CPUAVG[$i].Value),$($CPUsummation[$i].Value),$($memactiveAVG[$i].Value),$($memusageaverage[$i].Value),$($virtualdiskwriteAVG[$diskus].Value),$($virtualdiskreadAVG[$diskus].Value),$($networkbytesTXAVG[$i].Value),$($networkbytesRXAVG[$i].Value),$($networkAVG[$i].Value),$($powerusageAVG[$i].Value)" -Path $fileName
$diskus++
}
else
{
Add-Content -Value "$($CPUAVG[$i].Entity.Name),$($CPUAVG[$i].Timestamp),$($CPUAVG[$i].Value),$($memusageaverage[$i].Value),0,$($netusageaverage[$i].Value)" -Path $fileName
}
}
}
return(0)
Disconnect-VIServer -Confirm:$false
#######################################################################################
# Metrics collection
#-----------------------------------------------------------------------------------
#mem.usage.average Memory usage as percent of total configured or available memory. | percent
#mem.active.average The amount of memory used by the VM in the past small window of time. This is the "true" number of how much memory the VM currently has need of. Additional, unused memory may be swapped out or ballooned with no impact to the guest's performance. | kiloBytes
#cpu.used.summation CPU Used | millisecond
#cpu.usage.average The CPU utilization. This value is reported with 100% representing all processor cores on the system. As an example, a 2-way VM using 50% of a four-core system is completely using two cores. | percent
#net.bytesRx.average Average amount of data received per second. network adapter | KiB
#net.bytesTx.average Average amount of data transmitted per second. network adapter | KiB
#net.usage.average Network Usage (Average) | kiloBytesPerSecond
#power.power.average Current power usage. | Watts
#virtualDisk.write.average Average number of kilobytes written to the virtual disk each second. | KiB
#virtualDisk.read.average Average number of kilobytes written to the virtual disk each second. | KiB
Accepted Solutions
- Mark as New
- Bookmark
- Subscribe
- Mute
- Subscribe to RSS Feed
- Permalink
- Report Inappropriate Content
You can just add a Sort-Object before the Export-Csv.
As I said earlier, you will have to remove the Instance parameter.
This will require an additional condition for the Instance for the CPU and Net metrics.
You can get the average IOPS for all disks with the virtualDisk.numberReadAveraged.average and the virtualDisk.numberWriteAveraged.average metrics.
The net.usage.maximum metric does not exist for Realtime stats.
This is a metric, at Statistics Level 4, created by aggregation on the VCSA.
Connect-VIServer -Server xxxxxxxxxxx -Protocol https -User "administrator@vsphere.local" -Password xxxxxxxxxxx!

# I assume the CSV contains a column with the label 'Name'
$servers = Get-VM -Name (Import-Csv -Path C:\xxxxxxxxxxx\vms_SH50.csv -UseCulture).Name
$vms = Get-VM -Name $servers

$stat = 'virtualDisk.numberReadAveraged.average', 'virtualDisk.numberWriteAveraged.average',
  'net.bytesRx.average', 'net.bytesTx.average', 'net.usage.average', 'net.droppedRx.summation', 'net.droppedTx.summation',
  'net.received.average', 'net.transmitted.average', 'net.packetsRx.summation',
  'power.power.average',
  'mem.active.average', 'mem.usage.average',
  'cpu.used.summation', 'cpu.usage.average'


$sStat = @{
  Entity = $vms
  MaxSamples = 180
  Realtime = $true
  Stat = $stat
#  Instance = ''
}
$now = Get-Date -f yyyy-MM-dd
Get-Stat @SStat |
Group-Object -Property Entity -PipelineVariable group |
ForEach-Object -Process {
  $fileName = "C:\Users\xxxxxxxxxxx\$($group.Name)-$now.csv"

  $group.Group | Group-Object -Property Timestamp -PipelineVariable row |
  ForEach-Object -Process {
    New-Object -TypeName PSObject -Property ([ordered]@{
        'VM_Server_Name' = $group.Name
        'Timestamp' = $row.Name
        'Avg_CPU (%)' = ($row.Group.Where{ $_.MetricId -eq 'cpu.usage.average' }).Value
        'Avg_CPU (millisecond)' = ($row.Group.Where{ $_.MetricId -eq 'cpu.used.summation' -and $_.Instance -eq '' }).Value
        'Active_MEM (kiloBytes)' = ($row.Group.Where{ $_.MetricId -eq 'mem.active.average' }).Value
        'Avg_MEM (%)' = ($row.Group.Where{ $_.MetricId -eq 'mem.usage.average' }).Value
        'Disk_Write_Avg (IOPS)' = ($row.Group.Where{ $_.MetricId -eq 'virtualDisk.numberWriteAveraged.average' } | Measure-Object -Property Value -Average).Average
        'Disk_Read_Avg (IOPS)' = ($row.Group.Where{ $_.MetricId -eq 'virtualDisk.numberReadAveraged.average' } | Measure-Object -Property Value -Average).Average
        'Net_Dropped_Rx_Pkts (#)' = ($row.Group.Where{ $_.MetricId -eq 'net.droppedRx.summation' -and $_.Instance -eq '' }).Value
        'Net_Dropped_Tx_Pkts (#)' = ($row.Group.Where{ $_.MetricId -eq 'net.droppedTx.summation' -and $_.Instance -eq '' }).Value
        'Net_Bytes_Throughput_Rx_AVG (kiloBytes Per Sec)' = ($row.Group.Where{ $_.MetricId -eq 'net.received.average' -and $_.Instance -eq '' }).Value
        'Net_Bytes_Throughput_Tx_AVG (kiloBytes Per Sec)' = ($row.Group.Where{ $_.MetricId -eq 'net.transmitted.average' -and $_.Instance -eq '' }).Value
        'Net_Pkts_Rx (#)' = ($row.Group.Where{ $_.MetricId -eq 'net.packetsRx.summation' -and $_.Instance -eq '' }).Value
        'Net_Pkts_Tx (#)' = ($row.Group.Where{ $_.MetricId -eq 'net.packetsTx.summation' -and $_.Instance -eq '' }).Value
        'Net_Avg_Tx (kiloBytes Per Sec)' = ($row.Group.Where{ $_.MetricId -eq 'net.bytesTx.average' -and $_.Instance -eq '' }).Value
        'Net_Avg_Rx (kiloBytes Per Sec)' = ($row.Group.Where{ $_.MetricId -eq 'net.bytesRx.average' -and $_.Instance -eq '' }).Value
        'Net_Avg (kiloBytes Per Sec)' = ($row.Group.Where{ $_.MetricId -eq 'net.usage.average' -and $_.Instance -eq '' }).Value
        'Power_Consumed (Watts)' = ($row.Group.Where{ $_.MetricId -eq 'power.power.average' }).Value
      })
  } | Sort-Object -Property Timestamp |
  Export-Csv -Path $fileName -NoTypeInformation -UseCulture -Append
}

Disconnect-VIServer -Confirm:$false
Blog: lucd.info Twitter: @LucD22 Co-author PowerCLI Reference
- Mark as New
- Bookmark
- Subscribe
- Mute
- Subscribe to RSS Feed
- Permalink
- Report Inappropriate Content
Sorry, but you lost me already in the 1st paragraph
I learned that not every VM has the same Statistics available to aggregate.
When I run Get-StatType -Entity "VM-Name" the command returns all stats available. I have copied them and pasted them into excel (sort them so they are descending) and the 5 VMs have different StatTypes available.
Which differences did you observe?
Did you add the Realtime switch on the Get-StatType cmdlet?
Next question, where did you find that code?
Using Set-Content to create a CSV file is somewhat ignoring that there is an Export-Csv cmdlet. Why?
And are you really editing code in Notepad++?
That is really making it very hard on yourself. Why not use something like Visual Studio Code?
It's free and provides a lot of advantages when coding.
Blog: lucd.info Twitter: @LucD22 Co-author PowerCLI Reference
- Mark as New
- Bookmark
- Subscribe
- Mute
- Subscribe to RSS Feed
- Permalink
- Report Inappropriate Content
Hi @LucD
Did you add the Realtimeswitch on the Get-StatType cmdlet?
I didn’t know I could run the real-time get stat type
Next question, where did you find that code?
Opulent tell you, I searched again and I mod the script so much that I cannot find it again.
Using Set-Content to create a CSV file is somewhat ignoring that there is an Export-Csv cmdlet. Why? I don’t know, I need to export-cab so I can append
And are you really editing code in Notepad++?
That is really making it very hard on yourself. Why not use something like Visual Studio Code? I do sometimes use vScode app
- Mark as New
- Bookmark
- Subscribe
- Mute
- Subscribe to RSS Feed
- Permalink
- Report Inappropriate Content
I'm most interested in your reply to my first question, which differences in available metrics did you observe for VMs?
Blog: lucd.info Twitter: @LucD22 Co-author PowerCLI Reference
- Mark as New
- Bookmark
- Subscribe
- Mute
- Subscribe to RSS Feed
- Permalink
- Report Inappropriate Content
I was able to find the command I ran in my notes..
I did run the get-stattype -entity "vm name" -realtime
I just reran the command against all 5 vm's i need to monitor, and the stat types are all the same today.
Maybe i did something wrong the other day?
this is what i got for all 5 vm's a few minutes ago.
| cpu.costop.summation |
| cpu.demand.average |
| cpu.demandEntitlementRatio.latest |
| cpu.entitlement.latest |
| cpu.idle.summation |
| cpu.latency.average |
| cpu.maxlimited.summation |
| cpu.overlap.summation |
| cpu.readiness.average |
| cpu.ready.summation |
| cpu.run.summation |
| cpu.swapwait.summation |
| cpu.system.summation |
| cpu.usage.average |
| cpu.usage.vcpus.average |
| cpu.usagemhz.average |
| cpu.used.summation |
| cpu.wait.summation |
| datastore.maxTotalLatency.latest |
| disk.maxTotalLatency.latest |
| mem.active.average |
| mem.activewrite.average |
| mem.compressed.average |
| mem.compressionRate.average |
| mem.consumed.average |
| mem.decompressionRate.average |
| mem.entitlement.average |
| mem.granted.average |
| mem.latency.average |
| mem.llSwapInRate.average |
| mem.llSwapOutRate.average |
| mem.llSwapUsed.average |
| mem.overhead.average |
| mem.overheadMax.average |
| mem.overheadTouched.average |
| mem.shared.average |
| mem.swapin.average |
| mem.swapinRate.average |
| mem.swapout.average |
| mem.swapoutRate.average |
| mem.swapped.average |
| mem.swaptarget.average |
| mem.usage.average |
| mem.vmmemctl.average |
| mem.vmmemctltarget.average |
| mem.zero.average |
| mem.zipped.latest |
| mem.zipSaved.latest |
| net.broadcastRx.summation |
| net.broadcastTx.summation |
| net.bytesRx.average |
| net.bytesTx.average |
| net.droppedRx.summation |
| net.droppedTx.summation |
| net.multicastRx.summation |
| net.multicastTx.summation |
| net.packetsRx.summation |
| net.packetsTx.summation |
| net.pnicBytesRx.average |
| net.pnicBytesTx.average |
| net.received.average |
| net.transmitted.average |
| net.usage.average |
| power.energy.summation |
| power.power.average |
| rescpu.actav1.latest |
| rescpu.actav15.latest |
| rescpu.actav5.latest |
| rescpu.actpk1.latest |
| rescpu.actpk15.latest |
| rescpu.actpk5.latest |
| rescpu.maxLimited1.latest |
| rescpu.maxLimited15.latest |
| rescpu.maxLimited5.latest |
| rescpu.runav1.latest |
| rescpu.runav15.latest |
| rescpu.runav5.latest |
| rescpu.runpk1.latest |
| rescpu.runpk15.latest |
| rescpu.runpk5.latest |
| rescpu.sampleCount.latest |
| rescpu.samplePeriod.latest |
| sys.heartbeat.latest |
| sys.osUptime.latest |
| sys.uptime.latest |
| virtualDisk.largeSeeks.latest |
| virtualDisk.mediumSeeks.latest |
| virtualDisk.numberReadAveraged.average |
| virtualDisk.numberWriteAveraged.average |
| virtualDisk.read.average |
| virtualDisk.readIOSize.latest |
| virtualDisk.readLatencyUS.latest |
| virtualDisk.readLoadMetric.latest |
| virtualDisk.readOIO.latest |
| virtualDisk.smallSeeks.latest |
| virtualDisk.totalReadLatency.average |
| virtualDisk.totalWriteLatency.average |
| virtualDisk.write.average |
| virtualDisk.writeIOSize.latest |
| virtualDisk.writeLatencyUS.latest |
| virtualDisk.writeLoadMetric.latest |
| virtualDisk.writeOIO.latest |
- Mark as New
- Bookmark
- Subscribe
- Mute
- Subscribe to RSS Feed
- Permalink
- Report Inappropriate Content
Ok, that sounds more plausible (all VMs having the same metrics).
On your code, instead of doing many Get-Stat cmdlets, you could do this all with one Get-Stat call,
Which should make the execution a bit faster.
On the append to a CSV, as long as the script runs on the same day the append will happen (the -Append switch on the Export-Csv cmdlet).
When it is the first run on a new day, the Append switch will just create the file.
Since you hardcode 180 samples, you have to take care that you don't run the code more than once in 1 hour, otherwise you will have duplicate entries in your CSV.
This wouldn't be a major problem since you could use the Sort-Object cmdlet with the Unique switch to eliminate duplicates.
I would tackle the script something like this
Connect-VIServer -Server '#####IP ADDR#####' -Protocol https -User "administrator@vsphere.local" -Password '#####PASS#####'

# I assume the CSV contains a column with the label 'Name'
$servers = Get-VM -Name (Import-Csv -Path /home/'####PATH######'/vms_SH50.csv -UseCulture).Name
$vms = Get-VM -Name $servers

$stat = 'virtualDisk.write.average', 'virtualDisk.read.average',
'net.bytesRx.average', 'net.bytesTx.average', 'net.usage.average',
'power.power.average',
'mem.active.average', 'mem.usage.average',
'cpu.used.summation', 'cpu.usage.average'

$sStat = @{
  Entity = $vms
  MaxSamples = 180
  Realtime = $true
  Stat = $stat
  Instance = ''
}
$now = Get-Date -f yyyy-MM-dd
Get-Stat @SStat |
Group-Object -Property Entity -PipelineVariable group |
ForEach-Object -Process {
  $fileName = "/home/'#####PATH#####'/$($group.Name)-$now.csv"

  $group.Group | Group-Object -Property Timestamp -PipelineVariable row |
  ForEach-Object -Process {
    New-Object -TypeName PSObject -Property ([ordered]@{
        'Server_Name' = $group.Name
        'Timestamp' = $row.Name
        'AVG_CPU (%)' = ($row.Group.Where{ $_.MetricId -eq 'cpu.usage.average' }).Value
        'CPU_Used (millisecond)' = ($row.Group.Where{ $_.MetricId -eq 'cpu.used.summation' }).Value
        'Active_MEM (kiloBytes)' = ($row.Group.Where{ $_.MetricId -eq 'mem.active.average' }).Value
        'AVG_MEM (%)' = ($row.Group.Where{ $_.MetricId -eq 'mem.usage.average' }).Value
        'Disk_Write_Avg (kiloBytes Per Sec)' = ($row.Group.Where{ $_.MetricId -eq 'virtualDisk.write.average' }).Value
        'Disk_Read_Avg (kiloBytes Per Second)' = ($row.Group.Where{ $_.MetricId -eq 'virtualDisk.read.average' }).Value
        'Net_AVG_Tx (KiB)' = ($row.Group.Where{ $_.MetricId -eq 'net.bytesTx.average' }).Value
        'Net_AVG_Rx (KiB)' = ($row.Group.Where{ $_.MetricId -eq 'net.bytesRx.average' }).Value
        'AVG_Net (kiloBytes Per Second)' = ($row.Group.Where{ $_.MetricId -eq 'net.usage.average' }).Value
        'Watts' = ($row.Group.Where{ $_.MetricId -eq 'power.power.average' }).Value
      })
  } | Export-Csv -Path $fileName -NoTypeInformation -UseCulture -Append
}

Disconnect-VIServer -Confirm:$false
Blog: lucd.info Twitter: @LucD22 Co-author PowerCLI Reference
- Mark as New
- Bookmark
- Subscribe
- Mute
- Subscribe to RSS Feed
- Permalink
- Report Inappropriate Content
Thank you so much, it worked immediately... I would never have been able to do what you did.
I added the following 2 metrics that are available in realtime for each VM.
I added to $stat the following 2 metrics
'virtualDisk.numberReadAveraged.average', 'virtualDisk.numberWriteAveraged.average'
and I added the following to the New-Object
- Mark as New
- Bookmark
- Subscribe
- Mute
- Subscribe to RSS Feed
- Permalink
- Report Inappropriate Content
Those 2 metrics are done per vDisk, there is no "aggregate" value (-Instance "").
Removing the -Instance "" parameter would make the script a bit more complex, the CPU metrics for example also have multiple instances.
How would you envisage reporting these virtualdisk metrics?
A column for each vDisk (which is not the same for each VM) or an average over all vDisks?
Blog: lucd.info Twitter: @LucD22 Co-author PowerCLI Reference
- Mark as New
- Bookmark
- Subscribe
- Mute
- Subscribe to RSS Feed
- Permalink
- Report Inappropriate Content
Thanks for the info, i thought they were treated the same as the other realtime metrics in the list.
How would you envisage reporting these virtualdisk metrics?
Like a HDD i was looking for number, simple number how many reads the vm is performing against the disk and how many writes to the disk.
A column for each vDisk (which is not the same for each VM) or an average over all vDisks?
We are using a vSAN spanning THREE hosts. Each VM has only one virtual hdd.
thanks again for all the help LucD..
Steve
- Mark as New
- Bookmark
- Subscribe
- Mute
- Subscribe to RSS Feed
- Permalink
- Report Inappropriate Content
If each VM only has 1 HDD I would take the average (just to cope with the exception where a VM has more than 1 HDD).
But you will need to change/drop the Instance parameter.
That has consequences for example for the CPU-related metrics, you will have to make sure to only take the value for the aggregate, not the individual core values.
Blog: lucd.info Twitter: @LucD22 Co-author PowerCLI Reference
- Mark as New
- Bookmark
- Subscribe
- Mute
- Subscribe to RSS Feed
- Permalink
- Report Inappropriate Content
@LucD You are a true lifesaver!
here is what Im running every hour.. except for the IOPs. it works great. I noticed that the export / append to csv is not ordered by time per se. each hour is in order but when it runs again it has the newest at the top and the oldest at the bottom. so row one is 2am, and row 180 is 3am. when the script appends the data to the csv it places 4am in row 181 and 3am in row 360.. basically it goes 2-1,3-2,4-3...
any way to have it append in sequential order?
lastly, I say IOPS, but can I capture an avg of IO every 20 seconds per vm without a major headache?
I truly dont need IO per second. Just disk IO every 20 seconds is fine.
thanks again,
Stephen
The script you helped me with:
############################################################
Connect-VIServer -Server xxxxxxxxxxx -Protocol https -User "administrator@vsphere.local" -Password xxxxxxxxxxx!
# I assume the CSV contains a column with the label 'Name'
$servers = Get-VM -Name (Import-Csv -Path C:\xxxxxxxxxxx\vms_SH50.csv -UseCulture).Name
$vms = Get-VM -Name $servers
$stat = 'virtualDisk.write.average', 'virtualDisk.read.average', 'net.bytesRx.average', 'net.bytesTx.average', 'net.usage.average', 'net.droppedRx.summation', 'net.droppedTx.summation',
'net.received.average', 'net.transmitted.average', 'net.packetsRx.summation', 'power.power.average', 'mem.active.average',
'mem.usage.average', 'cpu.used.summation', 'cpu.usage.average'
$sStat = @{
Entity = $vms
MaxSamples = 180
Realtime = $true
Stat = $stat
Instance = ''
}
$now = Get-Date -f yyyy-MM-dd
Get-Stat @SStat |
Group-Object -Property Entity -PipelineVariable group |
ForEach-Object -Process {
$fileName = "C:\Users\xxxxxxxxxxx\$($group.Name)-$now.csv"
$group.Group | Group-Object -Property Timestamp -PipelineVariable row |
ForEach-Object -Process {
New-Object -TypeName PSObject -Property ([ordered]@{
'VM_Server_Name' = $group.Name
'Timestamp' = $row.Name
'Avg_CPU (%)' = ($row.Group.Where{ $_.MetricId -eq 'cpu.usage.average' }).Value
'Avg_CPU (millisecond)' = ($row.Group.Where{ $_.MetricId -eq 'cpu.used.summation' }).Value
'Active_MEM (kiloBytes)' = ($row.Group.Where{ $_.MetricId -eq 'mem.active.average' }).Value
'Avg_MEM (%)' = ($row.Group.Where{ $_.MetricId -eq 'mem.usage.average' }).Value
'Disk_Write_Avg (kiloBytes Per Sec)' = ($row.Group.Where{ $_.MetricId -eq 'virtualDisk.write.average' }).Value
'Disk_Read_Avg (kiloBytes Per Sec)' = ($row.Group.Where{ $_.MetricId -eq 'virtualDisk.read.average' }).Value
'Net_Dropped_Rx_Pkts (#)' = ($row.Group.Where{ $_.MetricId -eq 'net.droppedRx.summation' }).Value
'Net_Dropped_Tx_Pkts (#)' = ($row.Group.Where{ $_.MetricId -eq 'net.droppedTx.summation' }).Value
'Net_Bytes_Throughput_Rx_AVG (kiloBytes Per Sec)' = ($row.Group.Where{ $_.MetricId -eq 'net.received.average' }).Value
'Net_Bytes_Throughput_Tx_AVG (kiloBytes Per Sec)' = ($row.Group.Where{ $_.MetricId -eq 'net.transmitted.average' }).Value
'Net_Usage_Max (kiloBytes Per Sec)' = ($row.Group.Where{ $_.MetricId -eq 'net.usage.maximum' }).Value
'Net_Pkts_Rx (#)' = ($row.Group.Where{ $_.MetricId -eq 'net.packetsRx.summation' }).Value
'Net_Pkts_Tx (#)' = ($row.Group.Where{ $_.MetricId -eq 'net.packetsTx.summation' }).Value
'Net_Avg_Tx (kiloBytes Per Sec)' = ($row.Group.Where{ $_.MetricId -eq 'net.bytesTx.average' }).Value
'Net_Avg_Rx (kiloBytes Per Sec)' = ($row.Group.Where{ $_.MetricId -eq 'net.bytesRx.average' }).Value
'Net_Avg (kiloBytes Per Sec)' = ($row.Group.Where{ $_.MetricId -eq 'net.usage.average' }).Value
'Power_Consumed (Watts)' = ($row.Group.Where{ $_.MetricId -eq 'power.power.average' }).Value
})
} | Export-Csv -Path $fileName -NoTypeInformation -UseCulture -Append
}
Disconnect-VIServer -Confirm:$false
- Mark as New
- Bookmark
- Subscribe
- Mute
- Subscribe to RSS Feed
- Permalink
- Report Inappropriate Content
You can just add a Sort-Object before the Export-Csv.
As I said earlier, you will have to remove the Instance parameter.
This will require an additional condition for the Instance for the CPU and Net metrics.
You can get the average IOPS for all disks with the virtualDisk.numberReadAveraged.average and the virtualDisk.numberWriteAveraged.average metrics.
The net.usage.maximum metric does not exist for Realtime stats.
This is a metric, at Statistics Level 4, created by aggregation on the VCSA.
Connect-VIServer -Server xxxxxxxxxxx -Protocol https -User "administrator@vsphere.local" -Password xxxxxxxxxxx!

# I assume the CSV contains a column with the label 'Name'
$servers = Get-VM -Name (Import-Csv -Path C:\xxxxxxxxxxx\vms_SH50.csv -UseCulture).Name
$vms = Get-VM -Name $servers

$stat = 'virtualDisk.numberReadAveraged.average', 'virtualDisk.numberWriteAveraged.average',
  'net.bytesRx.average', 'net.bytesTx.average', 'net.usage.average', 'net.droppedRx.summation', 'net.droppedTx.summation',
  'net.received.average', 'net.transmitted.average', 'net.packetsRx.summation',
  'power.power.average',
  'mem.active.average', 'mem.usage.average',
  'cpu.used.summation', 'cpu.usage.average'


$sStat = @{
  Entity = $vms
  MaxSamples = 180
  Realtime = $true
  Stat = $stat
#  Instance = ''
}
$now = Get-Date -f yyyy-MM-dd
Get-Stat @SStat |
Group-Object -Property Entity -PipelineVariable group |
ForEach-Object -Process {
  $fileName = "C:\Users\xxxxxxxxxxx\$($group.Name)-$now.csv"

  $group.Group | Group-Object -Property Timestamp -PipelineVariable row |
  ForEach-Object -Process {
    New-Object -TypeName PSObject -Property ([ordered]@{
        'VM_Server_Name' = $group.Name
        'Timestamp' = $row.Name
        'Avg_CPU (%)' = ($row.Group.Where{ $_.MetricId -eq 'cpu.usage.average' }).Value
        'Avg_CPU (millisecond)' = ($row.Group.Where{ $_.MetricId -eq 'cpu.used.summation' -and $_.Instance -eq '' }).Value
        'Active_MEM (kiloBytes)' = ($row.Group.Where{ $_.MetricId -eq 'mem.active.average' }).Value
        'Avg_MEM (%)' = ($row.Group.Where{ $_.MetricId -eq 'mem.usage.average' }).Value
        'Disk_Write_Avg (IOPS)' = ($row.Group.Where{ $_.MetricId -eq 'virtualDisk.numberWriteAveraged.average' } | Measure-Object -Property Value -Average).Average
        'Disk_Read_Avg (IOPS)' = ($row.Group.Where{ $_.MetricId -eq 'virtualDisk.numberReadAveraged.average' } | Measure-Object -Property Value -Average).Average
        'Net_Dropped_Rx_Pkts (#)' = ($row.Group.Where{ $_.MetricId -eq 'net.droppedRx.summation' -and $_.Instance -eq '' }).Value
        'Net_Dropped_Tx_Pkts (#)' = ($row.Group.Where{ $_.MetricId -eq 'net.droppedTx.summation' -and $_.Instance -eq '' }).Value
        'Net_Bytes_Throughput_Rx_AVG (kiloBytes Per Sec)' = ($row.Group.Where{ $_.MetricId -eq 'net.received.average' -and $_.Instance -eq '' }).Value
        'Net_Bytes_Throughput_Tx_AVG (kiloBytes Per Sec)' = ($row.Group.Where{ $_.MetricId -eq 'net.transmitted.average' -and $_.Instance -eq '' }).Value
        'Net_Pkts_Rx (#)' = ($row.Group.Where{ $_.MetricId -eq 'net.packetsRx.summation' -and $_.Instance -eq '' }).Value
        'Net_Pkts_Tx (#)' = ($row.Group.Where{ $_.MetricId -eq 'net.packetsTx.summation' -and $_.Instance -eq '' }).Value
        'Net_Avg_Tx (kiloBytes Per Sec)' = ($row.Group.Where{ $_.MetricId -eq 'net.bytesTx.average' -and $_.Instance -eq '' }).Value
        'Net_Avg_Rx (kiloBytes Per Sec)' = ($row.Group.Where{ $_.MetricId -eq 'net.bytesRx.average' -and $_.Instance -eq '' }).Value
        'Net_Avg (kiloBytes Per Sec)' = ($row.Group.Where{ $_.MetricId -eq 'net.usage.average' -and $_.Instance -eq '' }).Value
        'Power_Consumed (Watts)' = ($row.Group.Where{ $_.MetricId -eq 'power.power.average' }).Value
      })
  } | Sort-Object -Property Timestamp |
  Export-Csv -Path $fileName -NoTypeInformation -UseCulture -Append
}

Disconnect-VIServer -Confirm:$false
Blog: lucd.info Twitter: @LucD22 Co-author PowerCLI Reference
- Mark as New
- Bookmark
- Subscribe
- Mute
- Subscribe to RSS Feed
- Permalink
- Report Inappropriate Content
it seems as I am getting "0" for watts used returned for
'Power_Consumed (Watts)' = ($row.Group.Where{ $_.MetricId -eq 'power.power.average' }).Value
any thoughts or suggestions?
Steve
- Mark as New
- Bookmark
- Subscribe
- Mute
- Subscribe to RSS Feed
- Permalink
- Report Inappropriate Content
There are some known issues with the measuring of power consumption.
One of those seems to be when using an HPE custom image for ESXi 6.7.
But there were similar reports for other HW vendors and types.
Do you use a HW vendor provided custom ESXi image?
If yes, you might want look in the HW vendor's KB, or open a call.
If not, there have been issues with sensord in older (6.7 and earlier) ESXi versions.
Do you see the power consumption under the Performance tab in the Web Client?
Blog: lucd.info Twitter: @LucD22 Co-author PowerCLI Reference
- Mark as New
- Bookmark
- Subscribe
- Mute
- Subscribe to RSS Feed
- Permalink
- Report Inappropriate Content
I am using a custom HPE esxi7.0.3 image, patched to the "k" build.
I will check with HPE, I am also having an issue with net.packetsTX.summation which is a realtime stat.
It returns a blank column, not even "0" RX is fine, but the TX pull is an issue.
Steve
- Mark as New
- Bookmark
- Subscribe
- Mute
- Subscribe to RSS Feed
- Permalink
- Report Inappropriate Content
If you have iLO on those nodes, you might want to have a closer look at Scripting Tools for Windows PowerShell.
I do remember they also provide cmdlets to retrieve metrics from the iLO.
Unfortunately I don't have access to any HPE and can't check what is currently possible
Blog: lucd.info Twitter: @LucD22 Co-author PowerCLI Reference
- Mark as New
- Bookmark
- Subscribe
- Mute
- Subscribe to RSS Feed
- Permalink
- Report Inappropriate Content
i was able to resolve the issue with TX, thanks
- Mark as New
- Bookmark
- Subscribe
- Mute
- Subscribe to RSS Feed
- Permalink
- Report Inappropriate Content
We have attached a GPU to a vm in the bunch and now the memory shows 75% across the board because of the reservation. Anyway to capture the real memory usage?
thx,
Steve
- Mark as New
- Bookmark
- Subscribe
- Mute
- Subscribe to RSS Feed
- Permalink
- Report Inappropriate Content
When you have a GPU attached you should see gpu.mem metrics for that VM (with Get-StatType).
You could use those metrics to subtract from the global memory utilisation.
Blog: lucd.info Twitter: @LucD22 Co-author PowerCLI Reference
- Mark as New
- Bookmark
- Subscribe
- Mute
- Subscribe to RSS Feed
- Permalink
- Report Inappropriate Content
i ran get-stattype - entity vmname -realtime
no gpu is listed but the OS sees the gpu, its setup for direct i/o passthrough
Steve