Turn on suggestions
Auto-suggest helps you quickly narrow down your search results by suggesting possible matches as you type.
Showing results for
- VMware Technology Network
- :
- Digital Workspace
- :
- Horizon
- :
- Horizon Desktops and Apps
- :
- Horizon View Connection Server - How to view Syste...
VMware Horizon Community
Options
- Subscribe to RSS Feed
- Mark Topic as New
- Mark Topic as Read
- Float this Topic for Current User
- Bookmark
- Subscribe
- Mute
- Printer Friendly Page
- Mark as New
- Bookmark
- Subscribe
- Mute
- Subscribe to RSS Feed
- Permalink
- Report Inappropriate Content
Horizon View Connection Server - How to view System Health Issues
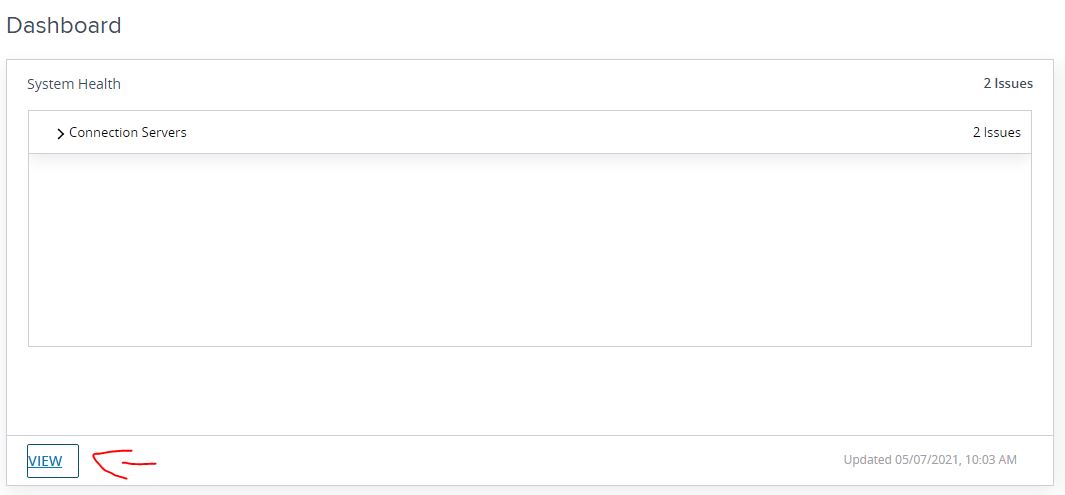
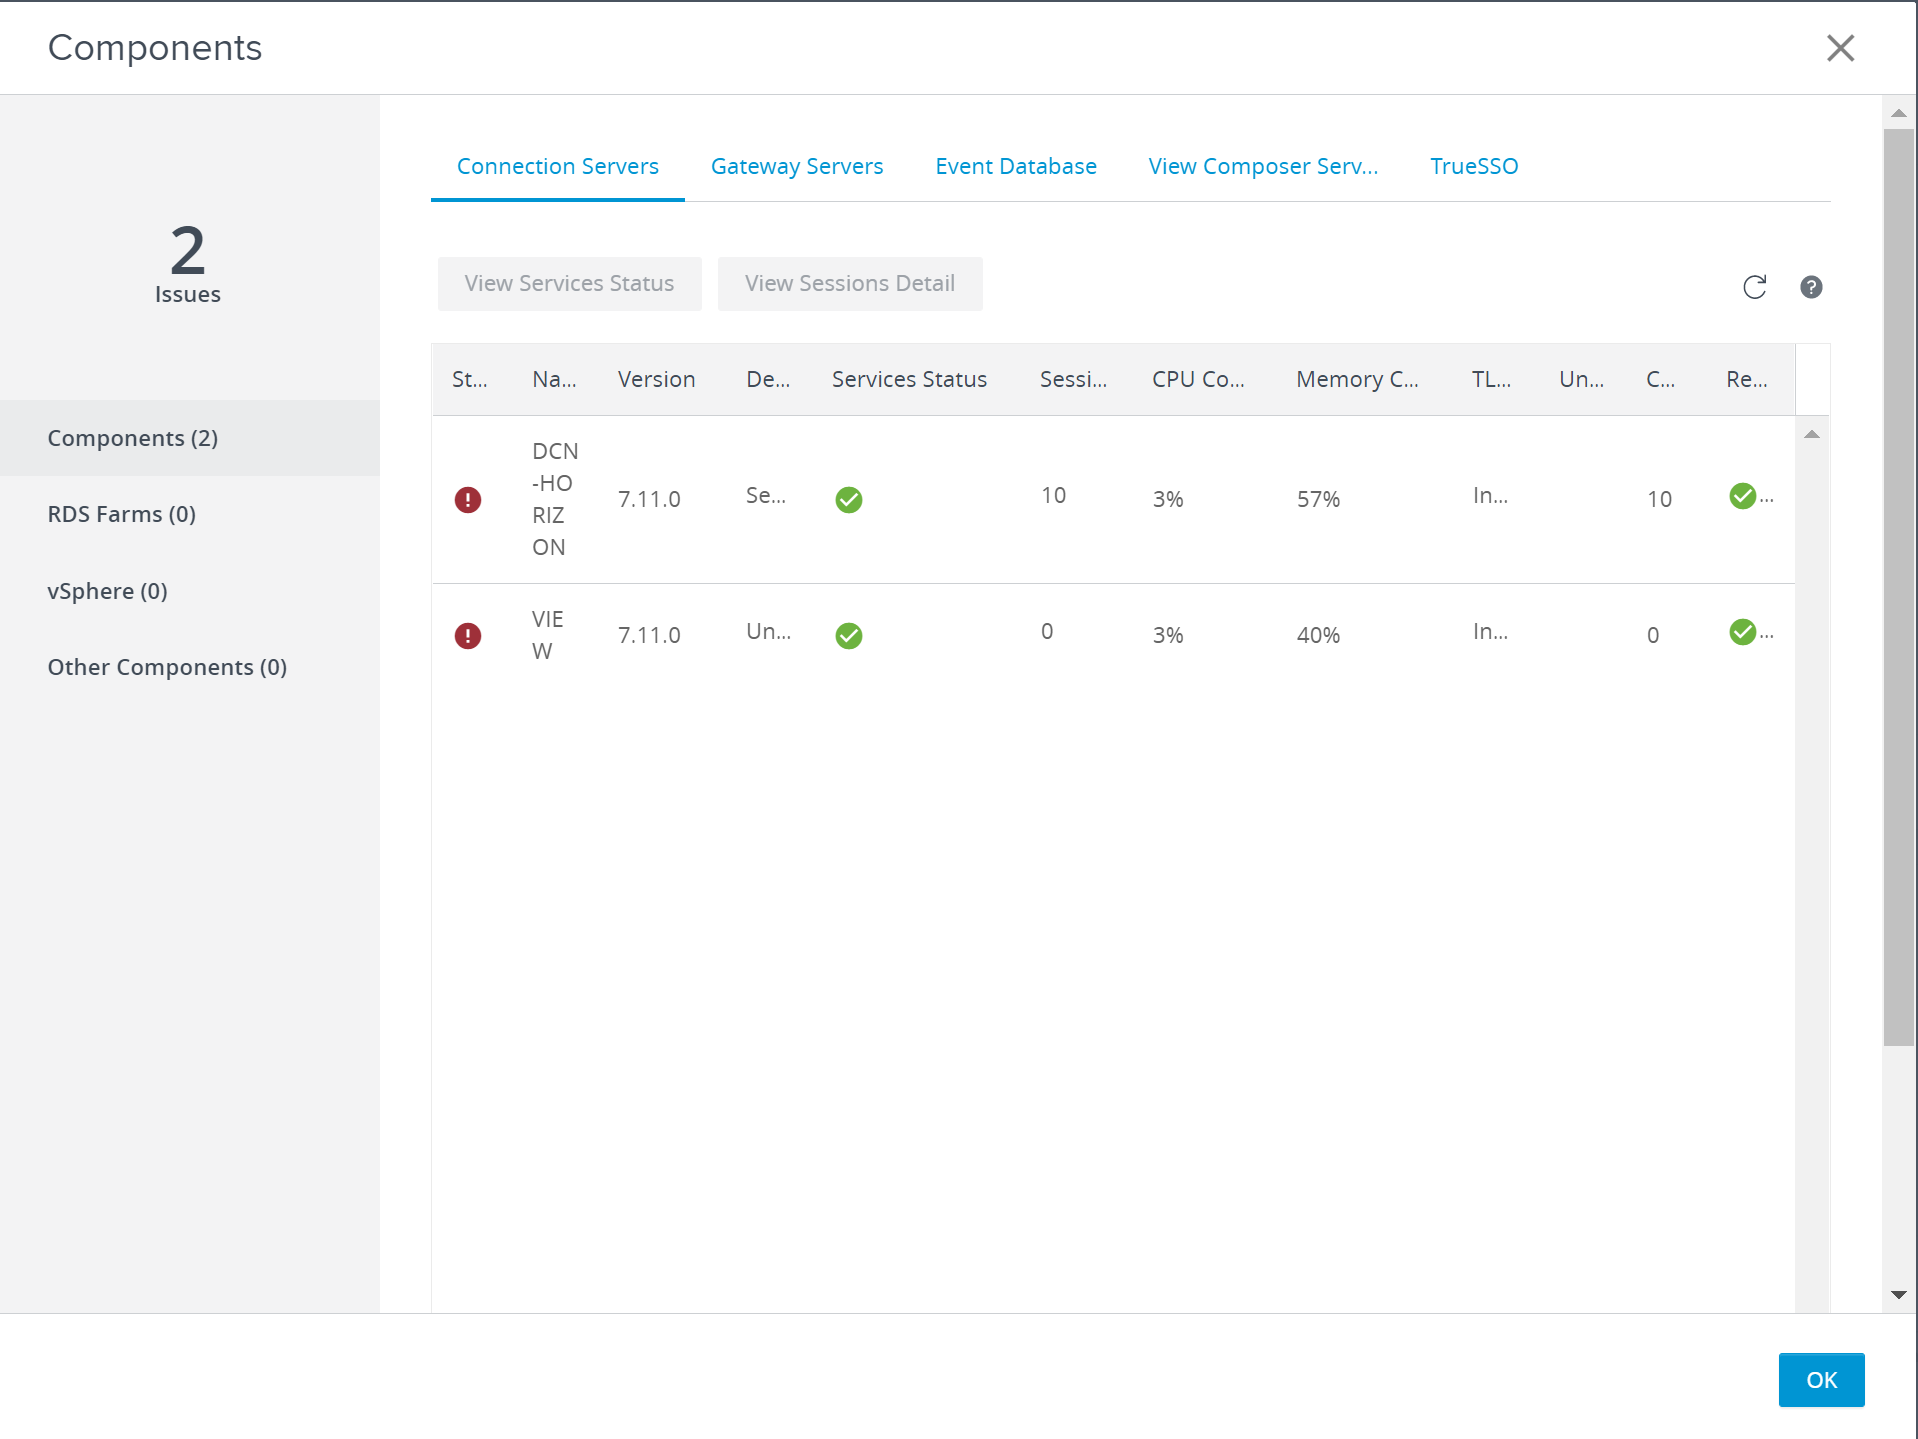
Hello. I have a two-cluster Horizon 7.11 pod, and the Dashboard shows that I have two issues in the System Health panel. When I click the "View" button, I am shown a new panel with displays both servers with a red status. However, I don't know how to drill down in to the two connection servers to display the issues. Even that panel that shows the servers is not resizable, so I cannot expand the columns to view the information in them.
I know there must be an easy way to view the underlying issues, but I'm not able to identify what it might be. Any suggestions on this would be much appreciated. Thanks!
5 Replies
- Mark as New
- Bookmark
- Subscribe
- Mute
- Subscribe to RSS Feed
- Permalink
- Report Inappropriate Content
- Mark as New
- Bookmark
- Subscribe
- Mute
- Subscribe to RSS Feed
- Permalink
- Report Inappropriate Content
- Mark as New
- Bookmark
- Subscribe
- Mute
- Subscribe to RSS Feed
- Permalink
- Report Inappropriate Content
- Mark as New
- Bookmark
- Subscribe
- Mute
- Subscribe to RSS Feed
- Permalink
- Report Inappropriate Content
Rogal7,
Thanks! That's the piece I was missing.
- Mark as New
- Bookmark
- Subscribe
- Mute
- Subscribe to RSS Feed
- Permalink
- Report Inappropriate Content
Good to hear that 😉 You can mark it as solved 😉