- VMware Technology Network
- :
- Cloud & SDDC
- :
- Enterprise Strategy & Planning
- :
- Enterprise Strategy & Planning Discussions
- :
- Open unofficial storage performance thread
- Subscribe to RSS Feed
- Mark Topic as New
- Mark Topic as Read
- Float this Topic for Current User
- Bookmark
- Subscribe
- Mute
- Printer Friendly Page
- Mark as New
- Bookmark
- Subscribe
- Mute
- Subscribe to RSS Feed
- Permalink
- Report Inappropriate Content
Open unofficial storage performance thread
Attention!
Since this thread is getting longer and longer, not to mention the load times, Christian and I decided to close this thread and start a new one.
The new thread is available here:
[VMware Communities User Moderator|http://communities.vmware.com/docs/DOC-2444][/i]
My idea is to create an open thread with uniform tests whereby the results will be all inofficial and w/o any
warranty.
If anybody shouldn't be agreed with some results then he can make own tests and presents
his/her results too.
I hope this way to classify the different systems and give a "neutral" performance comparison.
Additionally I will mention that the performance is one of many aspects to choose the right system.
The others could be e.g.
\- support quality
\- system management integration
\- distribution
\- self made experiences
\- additional features
\- costs for storage system and infrastructure, etc.
There are examples of IOMETER Tests:
=====================================
\######## TEST NAME: Max Throughput-100%Read
size,% of size,% reads,% random,delay,burst,align,reply
32768,100,100,0,0,1,0,0
\######## TEST NAME: RealLife-60%Rand-65%Read
size,% of size,% reads,% random,delay,burst,align,reply
8192,100,65,60,0,1,0,0
\######## TEST NAME: Max Throughput-50%Read
size,% of size,% reads,% random,delay,burst,align,reply
32768,100,50,0,0,1,0,0
\######## TEST NAME: Random-8k-70%Read
size,% of size,% reads,% random,delay,burst,align,reply
8192,100,70,100,0,1,0,0
The global options are:
=====================================
Worker
Worker 1
Worker type
DISK
Default target settings for worker
Number of outstanding IOs,test connection rate,transactions per connection
64,ENABLED,500
Disk maximum size,starting sector
8000000,0
Run time = 5 min
For testing the disk C is configured and the test file (8000000 sectors) will be created by
first running - you need free space on the disk.
The cache size has direct influence on results. By systems with cache over 2GB the test
file should be increased.
LINK TO IOMETER:
Significant results are: Av. Response time, Av. IOS/sek, Av. MB/s
To mention are: what server (vm or physical), Processor number/type; What storage system, How many disks
Here the config file *.icf
\####################################### BEGIN of *.icf
Version 2004.07.30
'TEST SETUP ====================================================================
'Test Description
IO-Test
'Run Time
' hours minutes seconds
0 5 0
'Ramp Up Time (s)
0
'Default Disk Workers to Spawn
NUMBER_OF_CPUS
'Default Network Workers to Spawn
0
'Record Results
ALL
'Worker Cycling
' start step step type
1 5 LINEAR
'Disk Cycling
' start step step type
1 1 LINEAR
'Queue Depth Cycling
' start end step step type
8 128 2 EXPONENTIAL
'Test Type
NORMAL
'END test setup
'RESULTS DISPLAY ===============================================================
'Update Frequency,Update Type
4,WHOLE_TEST
'Bar chart 1 statistic
Total I/Os per Second
'Bar chart 2 statistic
Total MBs per Second
'Bar chart 3 statistic
Average I/O Response Time (ms)
'Bar chart 4 statistic
Maximum I/O Response Time (ms)
'Bar chart 5 statistic
% CPU Utilization (total)
'Bar chart 6 statistic
Total Error Count
'END results display
'ACCESS SPECIFICATIONS =========================================================
'Access specification name,default assignment
Max Throughput-100%Read,ALL
'size,% of size,% reads,% random,delay,burst,align,reply
32768,100,100,0,0,1,0,0
'Access specification name,default assignment
RealLife-60%Rand-65%Read,ALL
'size,% of size,% reads,% random,delay,burst,align,reply
8192,100,65,60,0,1,0,0
'Access specification name,default assignment
Max Throughput-50%Read,ALL
'size,% of size,% reads,% random,delay,burst,align,reply
32768,100,50,0,0,1,0,0
'Access specification name,default assignment
Random-8k-70%Read,ALL
'size,% of size,% reads,% random,delay,burst,align,reply
8192,100,70,100,0,1,0,0
'END access specifications
'MANAGER LIST ==================================================================
'Manager ID, manager name
1,PB-W2K3-04
'Manager network address
193.27.20.145
'Worker
Worker 1
'Worker type
DISK
'Default target settings for worker
'Number of outstanding IOs,test connection rate,transactions per connection
64,ENABLED,500
'Disk maximum size,starting sector
8000000,0
'End default target settings for worker
'Assigned access specs
'End assigned access specs
'Target assignments
'Target
C:
'Target type
DISK
'End target
'End target assignments
'End worker
'End manager
'END manager list
Version 2004.07.30
\####################################### ENDE of *.icf
TABLE SAMPLE
++++++++++++++++++++++++++++++++++++++++++++++++++++++++++++++++++++++++++
TABLE oF RESULTS
++++++++++++++++++++++++++++++++++++++++++++++++++++++++++++++++++++++++++
SERVER TYPE: VM or PHYS.
CPU TYPE / NUMBER: VCPU / 1
HOST TYPE: Dell PE6850, 16GB RAM; 4x XEON 51xx, 2,66 GHz, DC
STORAGE TYPE / DISK NUMBER / RAID LEVEL: EQL PS3600 x 1 / 14+2 Disks / R50
##################################################################################
TEST NAME--
Av. Resp. Time ms--
##################################################################################
Max Throughput-100%Read........__________..........__________.........__________
RealLife-60%Rand-65%Read......__________..........__________.........__________
Max Throughput-50%Read..........__________..........__________.........__________
Random-8k-70%Read.................__________..........__________.........__________
EXCEPTIONS: CPU Util.-XX%;
##################################################################################
I hope YOU JOIN IN !
Regards
Christian
A Google Spreadsheet version is here:
Message was edited by:
ken.cline@hp.com to remove ALL CAPS from thread title
Message was edited by:
RDPetruska
Added link to Atamido's Google Spreadsheet
- Mark as New
- Bookmark
- Subscribe
- Mute
- Subscribe to RSS Feed
- Permalink
- Report Inappropriate Content
Ok .. Sounds like a plan.. Hope to see SSD's with more run time in the future..
- Mark as New
- Bookmark
- Subscribe
- Mute
- Subscribe to RSS Feed
- Permalink
- Report Inappropriate Content
Server: IBM x3650, 2 x Intel x5450 3Ghz QC; 28Gb RAM
SAN: IBM DS3200 (SAS) with 6 x 750GB SATA in RAID10 (1Gb Cache
however when upgraded from 512MB tests were not affected.. which was
good)
Tests: Five tests were carried out whilst varying the SAN's
logical drive segment (block) size from 32 through to 512 (max
supported on DS3200). No block alignment was done or any other
performance tuning with either environment.
VMWare ESX 3.5 Update 3 | Citrix XenServer Enterprise 5.0.0 |
SAN Cache | 512MB | SCSI Controller | Buslogic | SAN Cache | 512MB | |||||
Block (Segment) size | 512 | VMFS block size | 1MB | Block (Segment) size | 512 | |||||
Test name | Avg Resp Time ms | Av IOs/sec | Av MB/sec | CPU Utilisation | Test name | Avg Resp Time ms | Av IOs/sec | Av MB/sec | CPU Utilisation | |
Max Throughput-100%Read | 2.1 | 20,146.7 | 629.6 | 88.5 | Max Throughput-100%Read | 4.3 | 14,202.2 | 443.8 | 20.4 | |
RealLife-60%Rand-65%Read | 81.9 | 681.8 | 5.3 | 22.7 | RealLife-60%Rand-65%Read | 81.3 | 691.8 | 5.4 | 19.7 | |
Max Throughput-50%Read | 8.9 | 6,605.4 | 206.4 | 38.3 | Max Throughput-50%Read | 8.5 | 6,999.9 | 218.7 | 13.9 | |
Random-8k-70%Read | 94.1 | 574.0 | 4.5 | 26.2 | Random-8k-70%Read | 92.5 | 588.7 | 4.6 | 23.1 | |
SAN Cache | 512MB | SCSI Controller | Buslogic | SAN Cache | 512MB | |||||
Block (Segment) size | 256 | VMFS block size | 1MB | Block (Segment) size | 256 | |||||
Test name | Avg Resp Time ms | Av IOs/sec | Av MB/sec | CPU Utilisation | Test name | Avg Resp Time ms | Av IOs/sec | Av MB/sec | CPU Utilisation | |
Max Throughput-100%Read | 17.0 | 3,527.8 | 110.2 | 23.2 | Max Throughput-100%Read | 4.3 | 14,023.4 | 438.2 | 21.3 | |
RealLife-60%Rand-65%Read | 246.8 | 242.5 | 1.9 | 14.2 | RealLife-60%Rand-65%Read | 82.9 | 684.2 | 5.3 | 18.6 | |
Max Throughput-50%Read | 35.4 | 1,696.7 | 53.0 | 19.1 | Max Throughput-50%Read | 9.0 | 6,661.1 | 208.2 | 14.3 | |
Random-8k-70%Read | 331.5 | 180.7 | 1.4 | 14.1 | Random-8k-70%Read | 94.0 | 587.4 | 4.6 | 21.5 | |
SAN Cache | 512MB | SCSI Controller | Buslogic | SAN Cache | 512MB | |||||
Block (Segment) size | 128 | VMFS block size | 1MB | Block (Segment) size | 128 | |||||
Test name | Avg Resp Time ms | Av IOs/sec | Av MB/sec | CPU Utilisation | Test name | Avg Resp Time ms | Av IOs/sec | Av MB/sec | CPU Utilisation | |
Max Throughput-100%Read | 17.4 | 3,443.4 | 107.6 | 24.2 | Max Throughput-100%Read | 3.9 | 15,616.5 | 488.0 | 20.8 | |
RealLife-60%Rand-65%Read | 253.9 | 236.1 | 1.8 | 14.1 | RealLife-60%Rand-65%Read | 85.9 | 660.0 | 5.2 | 18.2 | |
Max Throughput-50%Read | 35.6 | 842.2 | 52.5 | 19.7 | Max Throughput-50%Read | 8.8 | 6,802.0 | 212.6 | 14.2 | |
Random-8k-70%Read | 334.5 | 179.1 | 1.4 | 13.9 | Random-8k-70%Read | 93.5 | 579.6 | 4.5 | 24.5 | |
SAN Cache | 512MB | SCSI Controller | Buslogic | SAN Cache | 512MB | |||||
Block (Segment) size | 64 | VMFS block size | 1MB | Block (Segment) size | 64 | |||||
Test name | Avg Resp Time ms | Av IOs/sec | Av MB/sec | CPU Utilisation | Test name | Avg Resp Time ms | Av IOs/sec | Av MB/sec | CPU Utilisation | |
Max Throughput-100%Read | 17.9 | 3,345.0 | 104.5 | 23.6 | Max Throughput-100%Read | 4.0 | 15,077.8 | 471.2 | 20.3 | |
RealLife-60%Rand-65%Read | 263.7 | 226.6 | 1.8 | 14.0 | RealLife-60%Rand-65%Read | 90.1 | 627.7 | 4.9 | 18.7 | |
Max Throughput-50%Read | 35.6 | 1,682.8 | 52.6 | 18.9 | Max Throughput-50%Read | 8.8 | 6,792.7 | 212.3 | 14.4 | |
Random-8k-70%Read | 339.2 | 176.0 | 1.4 | 13.8 | Random-8k-70%Read | 99.6 | 551.4 | 4.3 | 22.4 | |
SAN Cache | 512MB | SCSI Controller | Buslogic | SAN Cache | 512MB | |||||
Block (Segment) size | 32 | VMFS block size | 1MB | Block (Segment) size | 32 | |||||
Test name | Avg Resp Time ms | Av IOs/sec | Av MB/sec | CPU Utilisation | Test name | Avg Resp Time ms | Av IOs/sec | Av MB/sec | CPU Utilisation | |
Max Throughput-100%Read | 20.6 | 2,913.2 | 91.0 | 23.0 | Max Throughput-100%Read | 4.1 | 14,916.9 | 466.2 | 20.2 | |
RealLife-60%Rand-65%Read | 281.8 | 212.0 | 1.7 | 14.2 | RealLife-60%Rand-65%Read | 99.2 | 571.7 | 4.5 | 18.4 | |
Max Throughput-50%Read | 35.8 | 1,675.6 | 52.4 | 18.7 | Max Throughput-50%Read | 9.1 | 6,503.1 | 203.2 | 15.8 | |
Random-8k-70%Read | 353.7 | 169.6 | 1.3 | 13.3 | Random-8k-70%Read | 111.3 | 508.8 | 4.0 | 18.6 |
Rather then adding to this already long thread, I suggest discussion re this specific results please go to http://communities.vmware.com/thread/196031
- Mark as New
- Bookmark
- Subscribe
- Mute
- Subscribe to RSS Feed
- Permalink
- Report Inappropriate Content
I've just noticed your test results on DS3400 - the numbers are very low - check your configurations!!
- Mark as New
- Bookmark
- Subscribe
- Mute
- Subscribe to RSS Feed
- Permalink
- Report Inappropriate Content
Thanks for that input ![]()
- Mark as New
- Bookmark
- Subscribe
- Mute
- Subscribe to RSS Feed
- Permalink
- Report Inappropriate Content
Hi, nice to see that kind of results..
Could you just publish the VM configuration in both environments? RAM, OS, Filesystem.
Also.. If you are using Windows Server 2003, it would only be fair to change the SCSI controller to LSI instead of BusLogic.
I Cant remember... Does Citrix use Parallel VIrtualized SCSI Drivers?
- Mark as New
- Bookmark
- Subscribe
- Mute
- Subscribe to RSS Feed
- Permalink
- Report Inappropriate Content
VM for my tests is Win2003 std server SP2 with current updates, 384MB RAM. For each block size test I created a 200Gb LUN and formatted it NTFS using default NTFS block size.
Win2003 install is vanilla as can be. I also reinstalled vmware tools cleanly just to make sure its all installed correctly.
Changing over to LSI didn't result any major changes:
SAN Cache | 512MB | SCSI Controller | LSI | |
Block (Segment) size | 512 | VMFS block size | 1MB | |
Test name | Avg Resp Time ms | Av IOs/sec | Av MB/sec | CPU Utilisation |
Max Throughput-100%Read | 2.6 | 20,074.4 | 627.3 | 81.4 |
RealLife-60%Rand-65%Read | 82.7 | 673.6 | 5.3 | 22.7 |
Max Throughput-50%Read | 8.8 | 6,667.0 | 208.3 | 37.0 |
Random-8k-70%Read | 94.3 | 571.9 | 4.5 | 26.1 |
SAN Cache | 512MB | SCSI Controller | Buslogic | |
Block (Segment) size | 512 | VMFS block size | 1MB | |
Test name | Avg Resp Time ms | Av IOs/sec | Av MB/sec | CPU Utilisation |
Max Throughput-100%Read | 2.1 | 20,146.7 | 629.6 | 88.5 |
RealLife-60%Rand-65%Read | 81.9 | 681.8 | 5.3 | 22.7 |
Max Throughput-50%Read | 8.9 | 6,605.4 | 206.4 | 38.3 |
Random-8k-70%Read | 94.1 | 574.0 | 4.5 | 26.2 |
- Mark as New
- Bookmark
- Subscribe
- Mute
- Subscribe to RSS Feed
- Permalink
- Report Inappropriate Content
Just redone the benchmarks under RAID 5 (5 x 750Gb with hot spare):
Based on these results ESX wins for Avg Response times and Xen for CPU, its a draw for IOs and throughput.
Whats interesting though, is that under RAID10 XEN peforms better, wins for pretty much all counters except for 100% read (except cpu)...
Anyone have any idea how Xen can be so unaffected by LUN level block size?
Server | IBM x3650 | RAM | 28 GB (667) |
CPU | 2 x Intel X5450 | SAN | IBM DS3200 (SAS) |
Num Drives | 6 x 750GB SATA | RAID Level | RAID5 + 1 Hot Spare |
VMWare ESX 3.5 Update 3 | *Citrix XenServer Enterprise 5.0.0* | |||||||||
SAN Cache | 1024MB | SCSI Controller | LSI | SAN Cache | 1024MB | |||||
*Block (Segment) size* | 512 | VMFS block size | 1MB | Block (Segment) size | 512 | |||||
Test name | Avg Resp Time ms | Av IOs/sec | Av MB/sec | CPU Utilisation | Test name | Avg Resp Time ms | Av IOs/sec | Av MB/sec | CPU Utilisation | |
*Max Throughput-100%Read* | 2.4 | 20,170.9 | 630.3 | 84.1 | Max Throughput-100%Read | 3.1 | 19,227.3 | 600.9 | 19.7 | |
RealLife-60%Rand-65%Read | 149.3 | 357.8 | 2.8 | 24.4 | RealLife-60%Rand-65%Read | 153.6 | 359.2 | 2.8 | 21.1 | |
*Max Throughput-50%Read* | 8.8 | 6,665.6 | 208.3 | 37.3 | Max Throughput-50%Read | 9.1 | 6,582.3 | 205.7 | 13.2 | |
Random-8k-70%Read | 171.5 | 301.2 | 2.4 | 27.6 | Random-8k-70%Read | 166.2 | 314.3 | 2.5 | 26.0 | |
SAN Cache | 1024MB | SCSI Controller | LSI | SAN Cache | 1024MB | |||||
*Block (Segment) size* | 256 | VMFS block size | 1MB | Block (Segment) size | 256 | |||||
Test name | Avg Resp Time ms | Av IOs/sec | Av MB/sec | CPU Utilisation | Test name | Avg Resp Time ms | Av IOs/sec | Av MB/sec | CPU Utilisation | |
*Max Throughput-100%Read* | 2.5 | 20,206.6 | 631.5 | 84.6 | Max Throughput-100%Read | 3.1 | 19,257.7 | 601.8 | 18.7 | |
RealLife-60%Rand-65%Read | 162.3 | 338.7 | 2.6 | 22.5 | RealLife-60%Rand-65%Read | 159.4 | 354.2 | 2.8 | 19.1 | |
*Max Throughput-50%Read* | 8.8 | 6,627.7 | 207.1 | 38.1 | Max Throughput-50%Read | 9.1 | 6,573.3 | 205.4 | 13.8 | |
Random-8k-70%Read | 184.6 | 293.6 | 2.3 | 23.8 | Random-8k-70%Read | 176.6 | 310.4 | 2.4 | 21.5 |
- Mark as New
- Bookmark
- Subscribe
- Mute
- Subscribe to RSS Feed
- Permalink
- Report Inappropriate Content
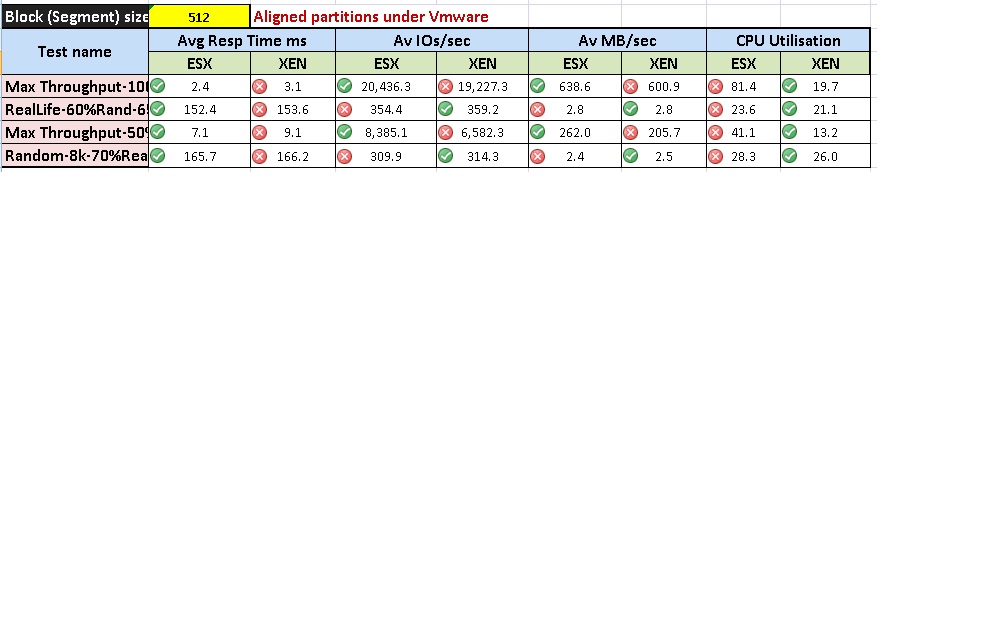
Further update, after realigning partitions under RAID5, its still a tie between ESX and XenServer:
Test name | ESX | XEN | ESX | XEN | ESX | XEN | ESX | XEN |
Max Throughput-100%Read | 2.4 | 3.1 | 20,436.3 | 19,227.3 | 638.6 | 600.9 | 81.4 | 19.7 |
RealLife-60%Rand-65%Read | 152.4 | 153.6 | 354.4 | 359.2 | 2.8 | 2.8 | 23.6 | 21.1 |
*Max Throughput-50%Read* | 7.1 | 9.1 | 8,385.1 | 6,582.3 | 262.0 | 205.7 | 41.1 | 13.2 |
Random-8k-70%Read | 165.7 | 166.2 | 309.9 | 314.3 | 2.4 | 2.5 | 28.3 | 26.0 |
- Mark as New
- Bookmark
- Subscribe
- Mute
- Subscribe to RSS Feed
- Permalink
- Report Inappropriate Content
And here are the final summary of RAID10 and RAID5 tests with ESX vs XenServer:
see attachment.
Cheers,
Max
- Mark as New
- Bookmark
- Subscribe
- Mute
- Subscribe to RSS Feed
- Permalink
- Report Inappropriate Content
ESX: 3.5 U3 143128
SYSTEM:IBM 3950 M2 / 64GB / Emulex Fiber SAN / Netapp 3070 / 15K SAS
VM: Windows 2003 R2 / 1GB
Access Specification Name | IOps | Read IOps | Write IOps | MBps | Read MBps | Write MBps | Average Response Time |
Max Throughput-100%Read | 3844.361848 | 3844.361848 | 0 | 120.136308 | 120.136308 | 0 | 5.735864 |
RealLife-60%Rand-65%Read | 2723.538409 | 1772.493252 | 951.045157 | 21.277644 | 13.847604 | 7.43004 | 19.332422 |
Max Throughput-50%Read | 4127.849316 | 2064.249641 | 2063.599676 | 128.995291 | 64.507801 | 64.48749 | 7.096561 |
Random-8k-70%Read | 2155.345519 | 1509.023551 | 646.321968 | 16.838637 | 11.789246 | 5.04939 | 24.746402 |

- Mark as New
- Bookmark
- Subscribe
- Mute
- Subscribe to RSS Feed
- Permalink
- Report Inappropriate Content
Thanks for that.
How many disks were used in the aggregate?
What features were on (dedup, thinprovisioning, etc.)
- Mark as New
- Bookmark
- Subscribe
- Mute
- Subscribe to RSS Feed
- Permalink
- Report Inappropriate Content
++++++++++++++++++++++++++++++++++++++++++++++++++++++++++++++++++++++++++
TABLE oF RESULTS
++++++++++++++++++++++++++++++++++++++++++++++++++++++++++++++++++++++++++
SERVER TYPE: Windows 2003 std VM on ESX 3.5.0 Update 3
CPU TYPE / NUMBER: VCPU / 1
HOST TYPE: IBM x3650, 16GB RAM; 2x XEON E5410 2,33 GHz Quad-Core
SAN Type: IBM DS3400 / Disks: 68GB 15k SAS / RAID LEVEL: Raid5 / 8 Disks / QLA 2432 4Gbit FC HBA
##################################################################################
TEST NAME--
Av. Resp. Time ms--
##################################################################################
Max Throughput-100%Read.......______5___..........___11419__........___357____
RealLife-60%Rand-65%Read..._____66___.........._____726__........_____6____
Max Throughput-50%Read.........______8___..........____7666__........___240____
Random-8k-70%Read................_____78___.........._____704__........_____6____
- Mark as New
- Bookmark
- Subscribe
- Mute
- Subscribe to RSS Feed
- Permalink
- Report Inappropriate Content
Great, thanks - is that throughput enough for you? I've just tested DS3400 with 6XSAS15k as R10 and saw ca. 1800 ios/sec (by Reallife-test).
- Mark as New
- Bookmark
- Subscribe
- Mute
- Subscribe to RSS Feed
- Permalink
- Report Inappropriate Content
I must say it seams to be performing preatty poorly.. I am not sure how much cache is in the controller. I will investigate.
- Mark as New
- Bookmark
- Subscribe
- Mute
- Subscribe to RSS Feed
- Permalink
- Report Inappropriate Content
by me only 512 MB, the response times were better too - ca. 40 ms
- Mark as New
- Bookmark
- Subscribe
- Mute
- Subscribe to RSS Feed
- Permalink
- Report Inappropriate Content
I had posted similar numbers a while back on a DS3300. Wasn't very impressive.
http://communities.vmware.com/message/943905#943905
My response times were similar to yours christianZ, but with IO under 500 with the "reallife" test. Of course, I was testing with only 3 drives at the time. I posted non-ESX (physical hardware) specs against the DS3300 and they were consistent with the VM results.
- Mark as New
- Bookmark
- Subscribe
- Mute
- Subscribe to RSS Feed
- Permalink
- Report Inappropriate Content
Ok when I now compare your results with that from mnemonic and my then I would say the box works poor with R5 config - but not sure here.
- Mark as New
- Bookmark
- Subscribe
- Mute
- Subscribe to RSS Feed
- Permalink
- Report Inappropriate Content
- « Previous
- Next »