- VMware Technology Network
- :
- Cloud & SDDC
- :
- Enterprise Strategy & Planning
- :
- Enterprise Strategy & Planning Discussions
- :
- New !! Open unofficial storage performance thread
- Subscribe to RSS Feed
- Mark Topic as New
- Mark Topic as Read
- Float this Topic for Current User
- Bookmark
- Subscribe
- Mute
- Printer Friendly Page
- Mark as New
- Bookmark
- Subscribe
- Mute
- Subscribe to RSS Feed
- Permalink
- Report Inappropriate Content
New !! Open unofficial storage performance thread
Hello everybody,
the old thread seems to be sooooo looooong - therefore I decided (after a discussion with our moderator oreeh - thanks Oliver -) to start a new thread here.
Oliver will make a few links between the old and the new one and then he will close the old thread.
Thanks for joining in.
Reg
Christian
- Mark as New
- Bookmark
- Subscribe
- Mute
- Subscribe to RSS Feed
- Permalink
- Report Inappropriate Content
Hi Folks,
I've been trying to extract the results for Avg IOs/Sec but can't seem to locate this in IOMeter. Can someone tell me were to look for these 3 variables. I can find AVG Resp. Time ms on the results tab, but can't fine Avg IOs/sec and AVG MB/sec.
Any help would be greatly appreciated.
Regards,
Rick
- Mark as New
- Bookmark
- Subscribe
- Mute
- Subscribe to RSS Feed
- Permalink
- Report Inappropriate Content
After you have finished running your iometer test you will have a results.csv file that you can open in Excel (or openoffice calc). Convert the data from comma seperated to text and all the values you need will be ready for you.


Lars
- Mark as New
- Bookmark
- Subscribe
- Mute
- Subscribe to RSS Feed
- Permalink
- Report Inappropriate Content
Lars very good info. So the raid triangle still works . Raid 10 still the fasted. Raid5 faster than Raid in real life and random 8K

- Mark as New
- Bookmark
- Subscribe
- Mute
- Subscribe to RSS Feed
- Permalink
- Report Inappropriate Content
Thanks Lars. I've opened it in excel and you said convert data from comma separated to text. I'm not sure where I'm suppose to do that.
I've attached a copy of my results.csv. Any chance you could convert it Excel and highlight the cells I'm suppose to look at and send it back to me in Xls format?
That would help me out immensely.
Regards,
Rick
- Mark as New
- Bookmark
- Subscribe
- Mute
- Subscribe to RSS Feed
- Permalink
- Report Inappropriate Content
- Mark as New
- Bookmark
- Subscribe
- Mute
- Subscribe to RSS Feed
- Permalink
- Report Inappropriate Content
Thanks so much lars!
- Mark as New
- Bookmark
- Subscribe
- Mute
- Subscribe to RSS Feed
- Permalink
- Report Inappropriate Content
SERVER TYPE: VM on vSphere ESX 4.0
CPU TYPE / NUMBER: VCPU / 1
HOST TYPE: DL385G5, 20GB RAM; 2x OPTERON 2356, 2,3 GHz, QC
STORAGE TYPE / DISK NUMBER / RAID LEVEL: Datacore SANmelody 3.0.0.1 / 12 disks / Raid10 Fiber 4Gbit FC HBA
2x SANmelody 3.0 update 1 4Gb in synchronous mirroring with a LUN each on a MSA60 SAS with 12x 15k SAS 300gb raid10
Test Name | Av. Resp Time ms | Av. IOs/sec | Av MB/sec |
Max Throughput-100%Read | 4.88 | 12158.99 | 379.96 |
RealLife-60%Rand-65%Read | 9.5 | 5377.39 | 42.01 |
Max Throughput-50%Read | 2.99 | 18133.13 | 566.66 |
Random-8k-70%Read | 15.72 | 3674.29 | 28.70 |
- Mark as New
- Bookmark
- Subscribe
- Mute
- Subscribe to RSS Feed
- Permalink
- Report Inappropriate Content
I was wondering if you guys can help me. I'm new with SAN storage but from what I can tell looking through this thread these look like pretty bad numbers. I'm not sure if this is cause of the SATA disks or not, but can anyone take a look and let me know what you think. Any recommendations on where I can gain performance? TIA. Tony
++++++++++++++++++++++++++++++++++++++++++++++++++++++++++++++++++++++++++++++++++
TABLE oF RESULTS
++++++++++++++++++++++++++++++++++++++++++++++++++++++++++++++++++++++++++++++++++
SERVER TYPE: VM Server 2003 R2 SP2 1GB RAM
CPU TYPE / NUMBER: VCPU / 1
HOST TYPE: ESX3.5 Build 158874, PE2950, 32GB RAM; 2x Intel Xeon
X5450 (3 GHz), Quad Core
STORAGE TYPE / DISK NUMBER / RAID LEVEL: Equallogic PS5000e, 16 Disks, 4TB SATA 7.2K, RAID50, firmware 4.14. iSCSI software initiator
##################################################################################
TEST NAME--
Av. Resp. Time ms--
##################################################################################
Max Throughput-100%Read......___3.24____......._1756.85__........._54.90___
RealLife-60%Rand-65%Read..___13.93____.......__501.98__.........__3.92___
Max Throughput-50%Read........___3.07____.......__1492.83__........._46.65___
Random-8k-70%Read...............___19.36____.......__500.31__.........__3.90___
EXCEPTIONS: CPU Util. 17% - 9% - 13% - 11%
##################################################################################
- Mark as New
- Bookmark
- Subscribe
- Mute
- Subscribe to RSS Feed
- Permalink
- Report Inappropriate Content
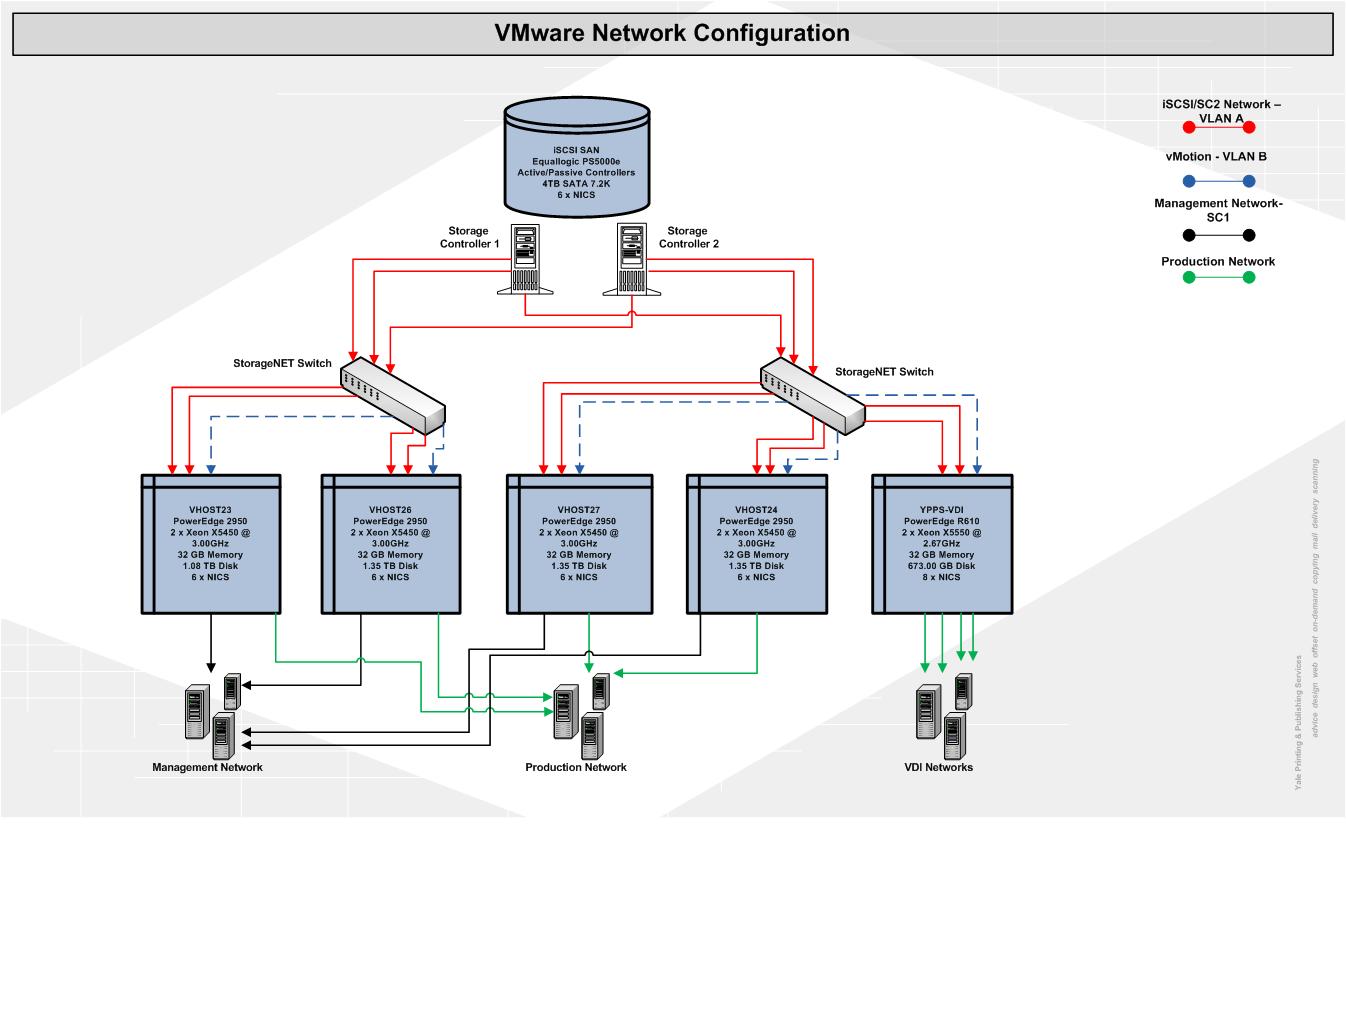
Could you give us a diagram of the network connections to the SAN (dedicated network ?)
- Mark as New
- Bookmark
- Subscribe
- Mute
- Subscribe to RSS Feed
- Permalink
- Report Inappropriate Content
Yeah, dedicated SAN network completely setup by the network guys. So the limiting factor may lye here somewhere. Other than that
2 physical lines going to each server, 2 VLANs: 1 x vmotion and 1xiSCSI/SC2,
I have all 3 (iSCSI, iSCSI SC, and vMotion) on one vswitch with both adapters teamed, route based on ip hash set, no jumbo frames.
- Mark as New
- Bookmark
- Subscribe
- Mute
- Subscribe to RSS Feed
- Permalink
- Report Inappropriate Content
Strange, it should rocks.
May be a missoconfiguration on the Equallogic Array.
Sorry but I couldn't help you on that kind of hardware.
Did you try just with raid5 array or raid0 instead of raid50 one ?
- Mark as New
- Bookmark
- Subscribe
- Mute
- Subscribe to RSS Feed
- Permalink
- Report Inappropriate Content
No I went straight to RAID 50 seeing as how that is supposed to give me pretty decent performance. I would have gone fore RAID 10 but on a 4TB array would have only gave 1.5 TB usable.
The only thing I cansee that might be causing soimoething is the MTU size. On the ESX servers its set to 1500, not sure about the ports on the swtich, but the ps5000 is set to 9000. Could this be causing this much degradation in performcance?
Tony
- Mark as New
- Bookmark
- Subscribe
- Mute
- Subscribe to RSS Feed
- Permalink
- Report Inappropriate Content
Try to set the MTU to 1500 on the PS5000, and test again
You can't set MTU to 9000 on the ESX server as VMware does not support them for iscsi software initiator with ESX 3.
Network admin should have set jumbo frame on the network switch too.
- Mark as New
- Bookmark
- Subscribe
- Mute
- Subscribe to RSS Feed
- Permalink
- Report Inappropriate Content
Thanks for the help. Does this command not work for the sw initiator
esxcfg-vswitch -m 9000 vSwitch1
- Mark as New
- Bookmark
- Subscribe
- Mute
- Subscribe to RSS Feed
- Permalink
- Report Inappropriate Content
When troubleshooting the first thing you'll want to do is reduce the number of variables involved. For examples:
Make sure SAN and Hosts are connected to the same physical switch (to reduce network variables)
Make sure Equallogic has a clean config. Start with empty disks if possible and have snapshots turned off (to reduce SAN variables)
Run the intiator tests from a Phsycial Windows environment instead of ESX (to reduce VM variables)
I know its not always possible do this in the real world, but I'm sure you get the idea.
P.S. I don't think its an MTU issue because the RealLife numbers are so low, meaning its not a bandwith issue. It could still be a latency issue though.
- Mark as New
- Bookmark
- Subscribe
- Mute
- Subscribe to RSS Feed
- Permalink
- Report Inappropriate Content
I'ld also test from a physical server, to rule out any VMware issues (which makes it a hell of a lot easier to pinpoint the bottleneck).
As I posted earlier in the thread, I got quite some different results using an out-of-the-box equallogic without tuning. I think I used a single blade with 2 paths, and MPIO (so that will be slightly better that what you will be able to get with VMware I think, but still).
Max Throughput-100%Read......___10.29____......._5694__........._177.94___
RealLife-60%Rand-65%Read.....___31.75____.......__1382__.........__10.80___
Max Throughput-50%Read.......___10.51____.......__5664__........._177.02___
Random-8k-70%Read............___34.34____.......__1345__.........__10.51___
- Mark as New
- Bookmark
- Subscribe
- Mute
- Subscribe to RSS Feed
- Permalink
- Report Inappropriate Content
SERVER TYPE: VM (XPSP3) on vSphere ESX 4.0
CPU TYPE / NUMBER: VCPU / 1
HOST TYPE: DL380G5, 32GB RAM; 2x Xeon X5470, 3.33 GHz, QC
STORAGE TYPE / DISK NUMBER / RAID LEVEL: Winchester SX2394R / 12 disks / 146G 15krpm SAS / Raid6
HBA 2x Qlogic QLE2560, Fabric sw QLogic SanBox 5802
Access Specification Name----Average Response Time--IOps--
MBps
Max Throughput-100%Read----4.9
11426--
357
RealLife-60%Rand-65%Read---15
3185--
24
Max Throughput-50%Read--
4.0
10979
343
Random-8k-70%Read--
16.6
2833
22
- Mark as New
- Bookmark
- Subscribe
- Mute
- Subscribe to RSS Feed
- Permalink
- Report Inappropriate Content
update: I ran the same test with our R610 used for VDI and the results were much improved. Any one have any thoughts? It seems all of the PE2950's are having the same problem. Thinking it was a nic manufacturer I've tried both the onboard Broadcom 5708 and the Quadport Intel Pro/1000 VT nics and both were close in performance.
++++++++++++++++++++++++++++++++++++++++++++++++++++++++++++++++++++++++++++++++++
TABLE oF RESULTS
++++++++++++++++++++++++++++++++++++++++++++++++++++++++++++++++++++++++++++++++++
SERVER TYPE: XP SP3 VM 1GB RAM
CPU TYPE / NUMBER: VCPU / 1
HOST TYPE: ESX3.5 Build 163429, R610, 32GB RAM; 2x Intel Xeon
X5550 (2.66 GHz), Quad Core
STORAGE TYPE / DISK NUMBER / RAID LEVEL: Equallogic PS5000e, 16 Disks,
4TB SATA 7.2K, RAID50, firmware 4.14. iSCSI software initiator
##################################################################################
TEST NAME--
Av. Resp. Time ms--
##################################################################################
Max Throughput-100%Read......___16.66____......._3542.95__........._110.70___
RealLife-60%Rand-65%Read..___30.65____.......__1304.31__.........__10.18___
Max Throughput-50%Read........___11.95____.......__3407.72__........._106.49___
Random-8k-70%Read...............___31.61____.......__1205.86__.........__9.42___
EXCEPTIONS: CPU Util. 33% - 57% - 56% - 46%
##################################################################################
- Mark as New
- Bookmark
- Subscribe
- Mute
- Subscribe to RSS Feed
- Permalink
- Report Inappropriate Content
Here is one test on an EVA 8000 FC SAN and one on a local SAS storage.
I guess these numbers here don't really appear to be impressive, considering the underlying storage system, are they?!. Especially the Max Throughput-50%Read values seem pretty weak, any idea what could be causing this?
SERVER TYPE: Windows 2003 R2 SP2 VM, 1.5GB RAM; virtual LSI logic parallel controller; dedicated 10 GB thick vmdk
CPU TYPE / NUMBER: 2 vCPU
HOST TYPE: ESX 4.0 GA; HP DL 380G6; 72GB RAM; 2x Xeon 5550 (2.66 GHz); 2x HP FC1142 Single Port FC HBA 4Gbit/s
STORAGE TYPE / DISK NUMBER / RAID LEVEL: HP EVA 8000 FC Storage / 74x 500GB FATA 7200 RPM disks / 500GB vDisk in vRAID5
##################################################################################
TEST NAME--
Av. Resp. Time ms--
##################################################################################
Max Throughput-100%Read......___11.6____.......__5361.1__........._167.5___
RealLife-60%Rand-65%Read..___10.5____.......__3675.9__.........__28.7___
Max Throughput-50%Read........___77.4____.......___758.3__.........__23.7___
Random-8k-70%Read...............___10.4____.......__3700.1__.........__28.9___
##################################################################################
Same Host, same VM but on local SAS storage:
SERVER TYPE: Windows 2003 R2 SP2 VM, 1.5GB RAM; virtual LSI logic parallel controller; dedicated 10 GB thick vmdk
CPU TYPE / NUMBER: 2 vCPU
HOST TYPE: ESX 4.0 GA; HP DL 380G6; 72GB RAM; 2x Xeon 5550 (2.66 GHz)
STORAGE TYPE / DISK NUMBER / RAID LEVEL: Local SAS on HP P410i Raid Controller, 512MB BBWC / 4x HP 450GB 15k RPM SAS / RAID 1+0
##################################################################################
TEST NAME--
Av. Resp. Time ms--
##################################################################################
Max Throughput-100%Read......___1.6____.......__36527.4__........._1141.5___
RealLife-60%Rand-65%Read..___19.8____.......__1773.7__.........___13.9___
Max Throughput-50%Read........___33.1____.......__1754.3__.........___54.9___
Random-8k-70%Read...............___20.3____.......__1743.9__.........___13.6___
##################################################################################
Did anyone try to run this iometer test on linux? I'm getting much lower results in linux (multiple distros), which are indifferent as to whether I use 1 or 64 (or something in between) outstanding IOs.