- VMware Technology Network
- :
- Cloud & SDDC
- :
- ESXi
- :
- ESXi Discussions
- :
- ESXi 6.5 only using half of CPU resources
- Subscribe to RSS Feed
- Mark Topic as New
- Mark Topic as Read
- Float this Topic for Current User
- Bookmark
- Subscribe
- Mute
- Printer Friendly Page
- Mark as New
- Bookmark
- Subscribe
- Mute
- Subscribe to RSS Feed
- Permalink
- Report Inappropriate Content
Hello everyone,
*background*
I'm new to both VMware products and sysadmin work in general so forgive me if some of this seems ignorant. I've inherited the task of troubleshooting a server that we've had for over a year now and has never been usable for my business. The main problem that's been keeping it from usability is that any VM's installed on it will encounter a soft freeze after a few days of idling, and the only way to fix it is to restart the host. I'm still working on narrowing down that one, but in the meantime I've found an issue that (I hope) is related and also prohibitive to this server's operation.
*host specs*
MPN: Dell Poweredge R620
CPU: 2x Xeon E5-2665 @2.4GHz
RAM: 8x4GB DDR3 @ 1600MHz
Storage: 4x 1TB @ 7200RPM Seagate Constellation ST91000640NS, configured in RAID 10
OS: Dell's curated version of ESXi 6.5 found on the support site for this product.
Firmware: It's all up to date, but I can provide versions for specific pieces if needed. I've updated this during the troubleshooting process and have confirmed that nothing has changed.
*Extras*
I'm using Veeam ONE(Community edition) as a secondary monitor for host resource usage
Additionally, I've installed the iDRAC Service Module in the host OS and enabled the ESXi shell for monitoring.
*the problem*
The ESXi host will never go past 50% of CPU consumption, it's a hard line that I've verified through the ESXi HTML5 client, Veeam ONE, and esxtop. Any VM installed on the host will max out at 50% of its CPU allocation by clock speed, while the guest OS is getting crushed by CpuStres or a linux shell analog. Changing the number of vCPU's doesn't seem to have an effect on this, with cycles scaling accordingly. I've tested the host directly by inputting "dd if=/dev/zero of=/dev/null&" into the ESXi shell once for each core/thread I want to test, and looking at the per-core/thread stats by using esxtop p. The %Used stat always maxes out at 50, while the $UTIL stat is at 100 and the %A/MPERF stat is perfectly static at 50.0 and never fluctuates regardless of load. I've recreated this with "logical processor" AKA hyperthreading disabled in the BIOS and recreated the same results.
Note that while the first picture displays different %used stats than I've described, these numbers only last until the first "refresh" of esxtop which is when they're 50% across the board. I assumed this was a reporting error but decided to include it just in case.
I'm not sure why this picture is displaying the %used as 25 this time, I've confirmed that it's displayed 50 with hyperthreading enabled in past tests, but I'd been fiddling in the BIOS a bit before this and may have inadvertently caused this.
I basically have full reign to do whatever I want to troubleshoot this, I've booted it to an Ultimate Bootable CD and it seems like it's capable of fully consuming the CPU here, but I may be misreading it. Screenshot attached below. Note that hyperthreading is turned off here.
Lastly, here's an example of a VM maxed out in the guest OS but only using half the host resources.
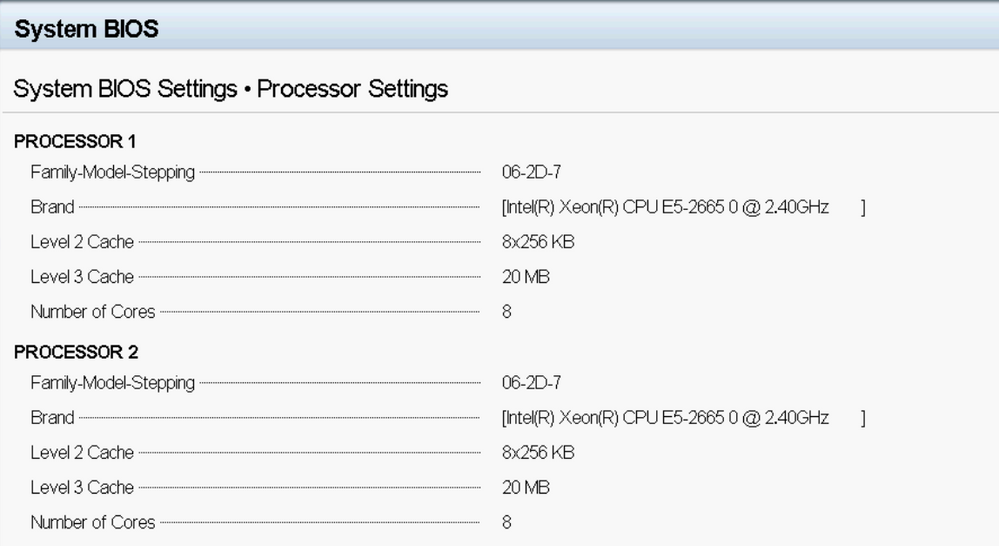
I can and am willing to do basically anything to get to the bottom of this, I just want to know if I'm focusing my efforts in the right place here, and what else I can do to narrow down this issue. if it winds up being a hardware issue so be it, but the reseller we got this from has been less than helpful on warranty work so I want to have a strong case if we point the finger at them again.Lastly, here's some screenshots of the BIOS with HT enabled.
Accepted Solutions
- Mark as New
- Bookmark
- Subscribe
- Mute
- Subscribe to RSS Feed
- Permalink
- Report Inappropriate Content
SOLVED: "iDRAC Reported Throttling on last attempt to characterize". Issue ultimately wound up being a bad PSU, swapping them out and rebooting host, therefore prompting In-System Characterization, pointed to one of them being specifically bad regardless of which slot in the backplane they were connected to.


