- VMware Technology Network
- :
- Cloud & SDDC
- :
- ESXi
- :
- ESXi Discussions
- :
- Re: ESXi 6.7 Performance graphs only show the last...
- Subscribe to RSS Feed
- Mark Topic as New
- Mark Topic as Read
- Float this Topic for Current User
- Bookmark
- Subscribe
- Mute
- Printer Friendly Page
- Mark as New
- Bookmark
- Subscribe
- Mute
- Subscribe to RSS Feed
- Permalink
- Report Inappropriate Content
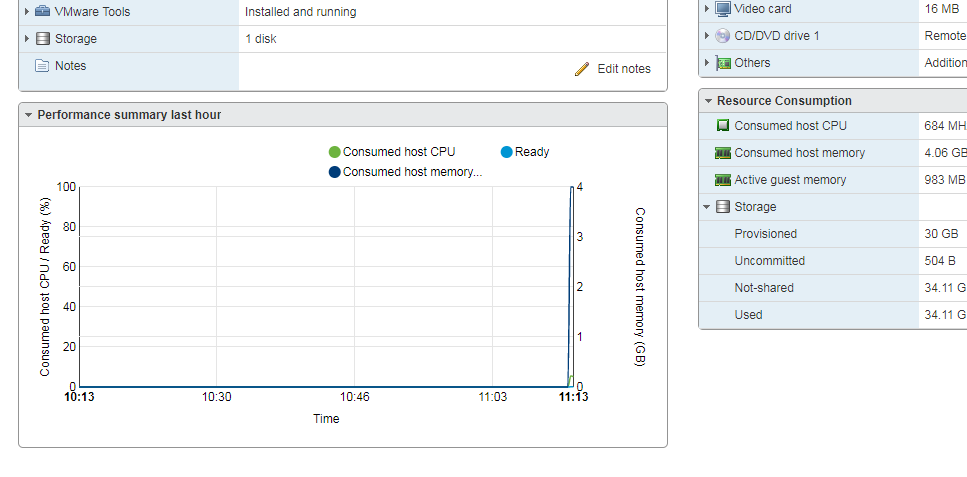
ESXi 6.7 Performance graphs only show the last few minutes
This is my second install of ESXi 6.7 U1 and I'm seeing the same problem. The performance monitoring graph on the host and on individual VMs only shows the last few minutes, no matter how long it has been up. This is the case with all counters (CPU/Network/Memory/Disk). Screenshots attached. Running the free license. I have tried restarting hostd, running with/without NTP, and, obviously, a full re-install. Any suggestions?
- Mark as New
- Bookmark
- Subscribe
- Mute
- Subscribe to RSS Feed
- Permalink
- Report Inappropriate Content
Hi,
Which is the problem?
If you restarted the host now from the time is up they will gather info and it will be shown in the graphs.
- Mark as New
- Bookmark
- Subscribe
- Mute
- Subscribe to RSS Feed
- Permalink
- Report Inappropriate Content
To clarify, the graphs shown in the screenshots reflect a host and guests with an uptime of several days.
- Mark as New
- Bookmark
- Subscribe
- Mute
- Subscribe to RSS Feed
- Permalink
- Report Inappropriate Content
All right, which statistics have you configured on vCenter?
https://www.vladan.fr/how-to-configure-statistics-collection-intervals-in-vcenter/
- Mark as New
- Bookmark
- Subscribe
- Mute
- Subscribe to RSS Feed
- Permalink
- Report Inappropriate Content
vCenter on Windows or VCSA?
On Windows the problem we see quite often and root cause wast hat the rolup of the statistic data wasnt working.
Regards,
Joerg
- Mark as New
- Bookmark
- Subscribe
- Mute
- Subscribe to RSS Feed
- Permalink
- Report Inappropriate Content
I am running the free ESXi license so I'm not running vCenter at all. These are the graphs being generated right in the web console of the ESXi server itself.
- Mark as New
- Bookmark
- Subscribe
- Mute
- Subscribe to RSS Feed
- Permalink
- Report Inappropriate Content
Oh, I am not sure if the Free ESXi license (I re-read your initial question) saves historical data on the ESXi host.
I can make a test for you in the weekend and let you know if it happens the same.
- Mark as New
- Bookmark
- Subscribe
- Mute
- Subscribe to RSS Feed
- Permalink
- Report Inappropriate Content
I have the exact same issue, vSphere 6.7, Free License, using the built in http client... performance monitor keep resetting after 15 - 20 mins.
I have two identical servers built.. but only the one has the issue....
Did you manage to find a solution?
- Mark as New
- Bookmark
- Subscribe
- Mute
- Subscribe to RSS Feed
- Permalink
- Report Inappropriate Content
I also have the same issue... performance metrics seen on the ESXi Embedded Host Client keep resetting every few minutes.
I'm running ESXi 6.7.0 Update 1 (Build 11675023).
- Mark as New
- Bookmark
- Subscribe
- Mute
- Subscribe to RSS Feed
- Permalink
- Report Inappropriate Content
If you are using a single esxi host without vCenter and connect directly to the host, you'll only see real-time performance. You need vCenter in order to see historical data. This is default behavior.
- Mark as New
- Bookmark
- Subscribe
- Mute
- Subscribe to RSS Feed
- Permalink
- Report Inappropriate Content
When not using vCenter and connecting directly to the host, one should see the past 1 hour of performance stats. This is not what is being reported by me or the OP. In our case, the metrics/charts are being reset every few minutes. Check the attached images posted by the OP.
- Mark as New
- Bookmark
- Subscribe
- Mute
- Subscribe to RSS Feed
- Permalink
- Report Inappropriate Content
We are seeing the same thing since updating to 6.7 Update 1. I've had a case open with VMware Support for over 2 weeks at this point and it hasn't gone very far. Very frustrating.
- Mark as New
- Bookmark
- Subscribe
- Mute
- Subscribe to RSS Feed
- Permalink
- Report Inappropriate Content
I liked the original post and clicked "I have the same question" in the hopes that this gets more attention. Regretting the "up"-grade from 6.5 to 6.7.
- Mark as New
- Bookmark
- Subscribe
- Mute
- Subscribe to RSS Feed
- Permalink
- Report Inappropriate Content
I've the same problem ![]()
In my lab enviroment 6.7 U2:
1 host with the same problem
1 host with perfect performance graphs...
![]()
- Mark as New
- Bookmark
- Subscribe
- Mute
- Subscribe to RSS Feed
- Permalink
- Report Inappropriate Content
That's interesting... for me, after upgrading to 6.7 U2, the problem has vanished.
It would be nice if more people could test with 6.7 U2 and post their results.
- Mark as New
- Bookmark
- Subscribe
- Mute
- Subscribe to RSS Feed
- Permalink
- Report Inappropriate Content
Upgrading to 6.7 Update 2 did not fix the issue for us. VMware also advised completely reinstalling from scratch as a troubleshooting step. We have a rather large environment and this would be a huge timesink.
- Mark as New
- Bookmark
- Subscribe
- Mute
- Subscribe to RSS Feed
- Permalink
- Report Inappropriate Content
I see the same issue, but mainly on VMware ESXi, 6.7.0, 9484548. The issue is not always the same. Some hosts are fine, some show only the last 5 min or 10 min or even 45 min. So far this issue is not visible on VMware ESXi, 6.7.0, 10764712 / 13006603. It has nothing to do with licenses (I'm on ent+) or vmotion. I run beefy hosts and no overcommiting, so vmotion never happens.
When the graphs are crippled to 5 min, that is for all VM's on that host. So that rules out an occasional vmotion.
It also has nothing to do with vCenter as some host on the same version are fine within same vCenter.
- Mark as New
- Bookmark
- Subscribe
- Mute
- Subscribe to RSS Feed
- Permalink
- Report Inappropriate Content
Just upgraded one of the hosts with issues from VMware ESXi, 6.7.0, 9484548 to VMware ESXi, 6.7.0, 13473784. Issue remains. My interval is 20 min here. Every 20 min the realtime graph gets deleted and re-collected.
This host is not a fresh installed host. It was installed with 6.5 and upgraded to 6.7 (HPE iso). Can it be an artefact from 6.5?
- Mark as New
- Bookmark
- Subscribe
- Mute
- Subscribe to RSS Feed
- Permalink
- Report Inappropriate Content
Just upgraded one of the hosts with issues from VMware ESXi, 6.7.0, 9484548 to VMware ESXi, 6.7.0, 13473784
No luck.
- Mark as New
- Bookmark
- Subscribe
- Mute
- Subscribe to RSS Feed
- Permalink
- Report Inappropriate Content
I have same issue. Four identical boxen running 6.7.0 Update 1 (Build 11675023)
Only one box has the performance stats resetting every 15 minutes or so.