- VMware Technology Network
- :
- Cloud & SDDC
- :
- vSAN
- :
- VMware vSAN Discussions
- :
- Re: Write latency and network errors
- Subscribe to RSS Feed
- Mark Topic as New
- Mark Topic as Read
- Float this Topic for Current User
- Bookmark
- Subscribe
- Mute
- Printer Friendly Page
- Mark as New
- Bookmark
- Subscribe
- Mute
- Subscribe to RSS Feed
- Permalink
- Report Inappropriate Content
Write latency and network errors
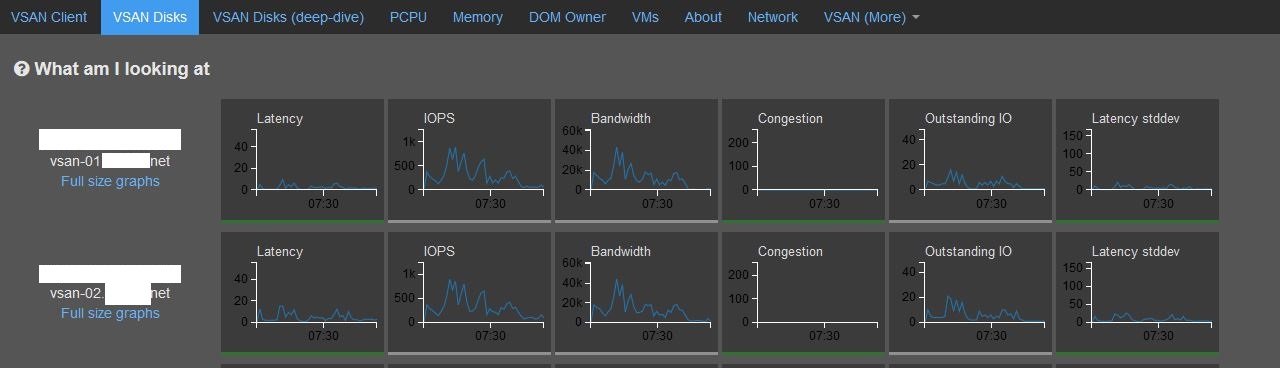
I'm trying to troubleshoot a write performance issue and noticed that there is VSCSI write latency. We have a 4 node cluster with dual 10GB links on brocade vdx switches. The only thing I noticed is that there are some out of order rx errors in vsan observer during the time of the latency. Has anyone seen this issue before? I'm attaching a screen shot from observer.

- Mark as New
- Bookmark
- Subscribe
- Mute
- Subscribe to RSS Feed
- Permalink
- Report Inappropriate Content
What exact version of ESXi and vSAN are you running?
Per
- Mark as New
- Bookmark
- Subscribe
- Mute
- Subscribe to RSS Feed
- Permalink
- Report Inappropriate Content
We are running the following.
VMware ESXi, 6.0.0, 4600944
VSAN 6.2
- Mark as New
- Bookmark
- Subscribe
- Mute
- Subscribe to RSS Feed
- Permalink
- Report Inappropriate Content
There are 10GbE nics out there where recently a new driver was released that leads to improved performance. Also, 6.0 U3 has a bunch of improvements, which I would recommend.
- Mark as New
- Bookmark
- Subscribe
- Mute
- Subscribe to RSS Feed
- Permalink
- Report Inappropriate Content
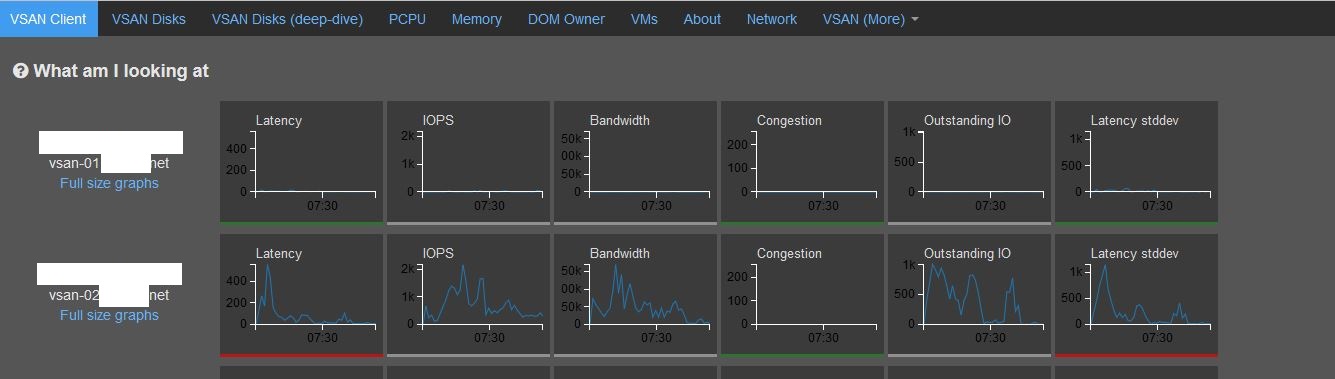
Thank you very much for the advice. I updated to the latest firmware and drivers for the nic. I also upgraded to 6.0 U3. I'm still seeing the errors and latencies. Overall, performance is good. I'm just trying to understand some inconsistencies and where I may be falling short or having a bottleneck. I'm attaching some more screen shots from observer while doing a large file copy within vsan. Any advice or direction is greatly appreciated.
- Mark as New
- Bookmark
- Subscribe
- Mute
- Subscribe to RSS Feed
- Permalink
- Report Inappropriate Content
Do you experience any congestion during the high write latency?
You will also want to see how much of the write cache on the SSD is already used up during the latency event. This is easier to see using SexiGraf (this is a free tool, just search google), which will show all the SSDs stats for a cluster on one page. I think in VSAN observer, if you deep dive to the SSD one of the graphs will show this too but for a single SSD at a time.
Just a theory but maybe the write buffer on the SSD fills up, then destaging to capacity disk becomes the bottleneck (this will show as congestion). Congestion will artificially introduce latency as a result which is maybe what you are seeing.
- Mark as New
- Bookmark
- Subscribe
- Mute
- Subscribe to RSS Feed
- Permalink
- Report Inappropriate Content
Possibly unrelated but maybe worth checking (as without detailed packet analysis I would not make any assumptions)
- Is RX and TX Flow Control disabled as per best practice?
p7-8 of:
Check if is enabled using:
# ethtool -a vmnic<#OfNic(s)InUseForVsanTrafficHere>
Set to off:
# ethtool --pause VMNic_Name tx off rx off
More info:
https://kb.vmware.com/kb/1013413
(checked and set on every host in the vSAN cluster of course)
Bob
- Mark as New
- Bookmark
- Subscribe
- Mute
- Subscribe to RSS Feed
- Permalink
- Report Inappropriate Content
What does your configuration look like (Server)? And how are you testing performance? (file copy is usually not how people test performance in my experience.)
- Mark as New
- Bookmark
- Subscribe
- Mute
- Subscribe to RSS Feed
- Permalink
- Report Inappropriate Content
We are running a 4 node hybrid cluster with HP DL380 G9's.
3 disk groups per host. Each group has a 200GB SSD HP MO0200JEFNV (Mainstream Endurance SFF) with 4 900GB 10k SAS magnetic disks per group. (EG0900JFCKB). P440 array controller.
Flow control is enabled. I did try disabling that before and it did not seem to have any effect. I'm not seeing any congestion. Write buffers are not filling up. A colleague is noting a performance inconsistency when doing sql backups from local disk to local disk on a windows server. We aren't having any problems with the environment. I'm just trying to see if there's anything that can be done to alleviate these concerns. Is there a recommended performance testing tool for vsan?
Thanks,
Mike
- Mark as New
- Bookmark
- Subscribe
- Mute
- Subscribe to RSS Feed
- Permalink
- Report Inappropriate Content
HCI Bench is recommended for VSAN testing.
- Mark as New
- Bookmark
- Subscribe
- Mute
- Subscribe to RSS Feed
- Permalink
- Report Inappropriate Content
Hi MichaelGi
Checking to see if you got to the bottom of this and curious to see what the resolution was to your high OOORx errors?
- Mark as New
- Bookmark
- Subscribe
- Mute
- Subscribe to RSS Feed
- Permalink
- Report Inappropriate Content
I never reached a resolution on this.
- Mark as New
- Bookmark
- Subscribe
- Mute
- Subscribe to RSS Feed
- Permalink
- Report Inappropriate Content
"Possibly unrelated but maybe worth checking (as without detailed packet analysis I would not make any assumptions)
- Is RX and TX Flow Control disabled as per best practice?"
That very same design guide advises to keep it enabled (pages 28 and 138). The document does not mention disabling it anywhere.
- Mark as New
- Bookmark
- Subscribe
- Mute
- Subscribe to RSS Feed
- Permalink
- Report Inappropriate Content
I've tried it both ways and we've still found the performance to be inconsistent. We ended up getting a storage array to use for our high performance servers.
- Mark as New
- Bookmark
- Subscribe
- Mute
- Subscribe to RSS Feed
- Permalink
- Report Inappropriate Content
Hello Srodenburg,
That link now points to the new Networking guide (which didn't exist at the time of my post), I can't seem to find a copy of it locally but maybe you can find one online somewhere if you want to clarify what it did/didn't say back then.
Edit: Found it, google VMware® vSAN™ Network Design-OLD - VMware Storage Hub:
"vSAN manages congestion by introducing artificial latency to prevent cache/buffer exhaustion. Since vSAN has built-in congestion management, disabling flow control on VMkernel interfaces tagged for vSAN traffic is recommended. Note Flow Control is enabled by default on all physical uplinks. For further information on Flow Control see KB1013413. VMware Recommends: Disable flow control for vSAN traffic."
And yes, good point that the recommendation for this has changed, nowadays we only advise disabling this with the switch-vendors blessing.
Bob
- Mark as New
- Bookmark
- Subscribe
- Mute
- Subscribe to RSS Feed
- Permalink
- Report Inappropriate Content
Did anyone got a solution for this?
- Mark as New
- Bookmark
- Subscribe
- Mute
- Subscribe to RSS Feed
- Permalink
- Report Inappropriate Content
Just wondering if you have checked the upstream switches and MTU settings on all the vmkernel nics. Mismatch MTUs may cause reties and network inconsistencies.
- Mark as New
- Bookmark
- Subscribe
- Mute
- Subscribe to RSS Feed
- Permalink
- Report Inappropriate Content
We are having the very same issue, albeit much worse. We are seeing latencies surpassing 1400 ms ( ! ) on a relatively empty 12-node VSAN stretched cluster (SR# 18750505903). The link between sites is less than 30% used with >1ms latency. The issue was discovered when a SQL server w/ 1.5TB DB was migrated into the cluster and began having major application issues.
VSAN 6.2 , ESXi 6.0.0 3620759.
Cisco UCS C240M4 hardware with Enterprise-grade SAS SSD/HDDs.Cluster is completely symmetrical. Hosts consist on 2 disk groups of 8 disks. (1) 400GB Enterprise SAS SSD / (7) 1.2 TB 10K SAS HDD." VSAN HCL validated multiple times for incorrect drivers, firmwares and even hardware. All check out.
I'm not seeing any pause frames on the upstream UCS Fabric Interconnects. Flow Control is not configured either, nor does it appear to be configurable on the VIC 1227:
[root@-------vsan-06:~] esxcli system module parameters list -m enic
Name Type Value Description
----------------- ---- ----- -------------------------------------------------------------------------
heap_initial int Initial heap size allocated for the driver.
heap_max int Maximum attainable heap size for the driver.
skb_mpool_initial int Driver's minimum private socket buffer memory pool size.
skb_mpool_max int Maximum attainable private socket buffer memory pool size for the driver.
[root@-------vsan-06:~] ethtool -a vmnic5
Pause parameters for vmnic5:
Cannot get device pause settings: Operation not supported
Per KB2146267 I tried disabling the dedup scanner but this did not improve anything. I also updated the pNIC drivers and that didn't help either.
- Mark as New
- Bookmark
- Subscribe
- Mute
- Subscribe to RSS Feed
- Permalink
- Report Inappropriate Content
We are also seeing a lot of these errors on our All Flash vSAN environment. We've been doing some testing and think we have narrowed down the issue.
We have 6 hosts with the following configuration..
SuperMicro 1028U-TR4+
2xIntel E5-2680v4
512GB RAM
X710-DA2 10GB Network Adapters (Dedicated for vSAN, not shared)
Cisco 3548 Switches (Dedicated for vSAN, not shared)
We went through different drives/firmware on our X710, but so far none of that has made a difference.
We noticed on our Cisco switch that all of the interfaces connected to our vSAN were having discards on a regular basis (multiple times every hour). We opened a support case with Cisco to troubleshoot this and found that ALL of our vSAN ports have bursts of traffic that are filling up the output buffers on the switch. During these bursts/full buffers the switch discards the packets.
So I would check on your switches to see if you are having any packet discards.
At this point Cisco is recommending we move to a deep buffer switch. I spoke with VMWare support to see if there is a specific switch they recommend (or buffers), but they said they just require a 10Gb switch. I find this frustrating as we have 2 expensive switches we are only using 6 ports on and may not be able to add any more hosts to.
Ethernet1/2 queuing information:
qos-group sched-type oper-bandwidth
0 WRR 100
Multicast statistics:
Mcast pkts dropped : 0
Unicast statistics:
qos-group 0
HW MTU: 16356 (16356 configured)
drop-type: drop, xon: 0, xoff: 0
Statistics:
Ucast pkts dropped : 180616
Ethernet1/2 is up
Dedicated Interface
Hardware: 100/1000/10000 Ethernet, address: 00d7.8faa.cf09 (bia 00d7.8faa.cf09)
MTU 1500 bytes, BW 10000000 Kbit, DLY 10 usec
reliability 255/255, txload 2/255, rxload 4/255
Encapsulation ARPA
Port mode is access
full-duplex, 10 Gb/s, media type is 10G
Beacon is turned off
Input flow-control is off, output flow-control is off
Rate mode is dedicated
Switchport monitor is off
EtherType is 0x8100
Last link flapped 4d12h
Last clearing of "show interface" counters 3d23h
0 interface resets
Load-Interval #1: 30 seconds
30 seconds input rate 98177624 bits/sec, 4262 packets/sec
30 seconds output rate 124356600 bits/sec, 4302 packets/sec
Load-Interval #2: 5 minute (300 seconds)
input rate 163.09 Mbps, 6.20 Kpps; output rate 113.03 Mbps, 6.33 Kpps
RX
2620601947 unicast packets 5716 multicast packets 335 broadcast packets
2620612576 input packets 10625804438347 bytes
1353181073 jumbo packets 0 storm suppression bytes
0 runts 0 giants 0 CRC 0 no buffer
0 input error 0 short frame 0 overrun 0 underrun 0 ignored
0 watchdog 0 bad etype drop 0 bad proto drop 0 if down drop
0 input with dribble 0 input discard
0 Rx pause
TX
2619585440 unicast packets 0 multicast packets 2452 broadcast packets
2619587892 output packets 9072740199246 bytes
1162617883 jumbo packets
0 output errors 0 collision 0 deferred 0 late collision
0 lost carrier 0 no carrier 0 babble 180616 output discard
0 Tx pause
- Mark as New
- Bookmark
- Subscribe
- Mute
- Subscribe to RSS Feed
- Permalink
- Report Inappropriate Content
For NIC issues, here is a typical checklist:
- Make sure the NICs are on the vSphere VCG
- Not only make sure that Firmware and Drivers are up to date (latest), BUT also that there are no mismatches
- Mismatches between these two have been know to cause some issues, in particular packet drops, based on my experience
- For the X710 (X71x & 72x) disabling LRO / TSO have resolved a lot of the issues encountered in the past.
- See Jase McCarty's script about this Vsan-Settings/Vsan-SetTsoLro.ps1 at master · jasemccarty/Vsan-Settings · GitHub