- VMware Technology Network
- :
- Cloud & SDDC
- :
- VMware Aria
- :
- VMware Aria Operations Discussions
- :
- Re: Active alert not showing in alert overview
- Subscribe to RSS Feed
- Mark Topic as New
- Mark Topic as Read
- Float this Topic for Current User
- Bookmark
- Subscribe
- Mute
- Printer Friendly Page
- Mark as New
- Bookmark
- Subscribe
- Mute
- Subscribe to RSS Feed
- Permalink
- Report Inappropriate Content
Active alert not showing in alert overview
I have ran into a weird situation.
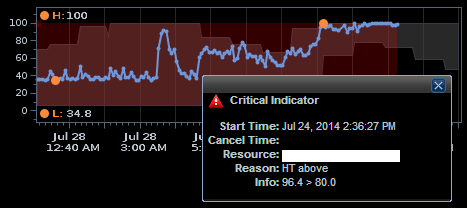
I can see an active alert when I track down to a resources metric graph with the widget.
But then when I go back to alert overview and try to locate that alert, I can't find that alert at all.
Any idea whats happening? The interface bugged?
fyi I have changed the attribute package HT settings, set up multi level alert, consolidate alert, yet it doesn't get any better after i reverted these changes and restart vcops.
- Mark as New
- Bookmark
- Subscribe
- Mute
- Subscribe to RSS Feed
- Permalink
- Report Inappropriate Content
Are you using the Custom UI? When you look at the active alert in the widget, what is the type/subtype?
- Mark as New
- Bookmark
- Subscribe
- Mute
- Subscribe to RSS Feed
- Permalink
- Report Inappropriate Content
I only see the alert here, its in a metric graph widget displaying anomalies.
The alert does not appear both in alert widget / alert overview
- Mark as New
- Bookmark
- Subscribe
- Mute
- Subscribe to RSS Feed
- Permalink
- Report Inappropriate Content
The alert overview should show every alert. It could be closed now.. are you sorting by both active and cancelled alerts? Make sure the alert overview is sorting everything from badges to anomalies, notifications, etc.
- Mark as New
- Bookmark
- Subscribe
- Mute
- Subscribe to RSS Feed
- Permalink
- Report Inappropriate Content
I believe having a red shade in the metric graph widget shows that the alert is still active right.
In the alert overview page, I guess this means showing everything?
- Mark as New
- Bookmark
- Subscribe
- Mute
- Subscribe to RSS Feed
- Permalink
- Report Inappropriate Content
Ya, you've got both active and canceled selected.. go ahead and start filter by badge/etc adding all of the filters. It's got to come up eventually..
- Mark as New
- Bookmark
- Subscribe
- Mute
- Subscribe to RSS Feed
- Permalink
- Report Inappropriate Content
Pretty sure that it's not there... I've scanned through the overview for times, filtering by name and by start and end time.
There is no alert there even for the specific time stamp. Any workaround to reset it? Or I have to reinstall everything?
- Mark as New
- Bookmark
- Subscribe
- Mute
- Subscribe to RSS Feed
- Permalink
- Report Inappropriate Content
Can you give the details on the resource/resourcekind and metric that has this alert?
- Mark as New
- Bookmark
- Subscribe
- Mute
- Subscribe to RSS Feed
- Permalink
- Report Inappropriate Content
Ah didn't notice that I hided the metric as well.
Esx Host | Core Utilization%
- Mark as New
- Bookmark
- Subscribe
- Mute
- Subscribe to RSS Feed
- Permalink
- Report Inappropriate Content
Somehow when I checked it again in office, the problem magically goes away.


