- VMware Technology Network
- :
- Cloud & SDDC
- :
- ESXi
- :
- ESXi Discussions
- :
- Re: ESXi 5 Multiple hosts crash
- Subscribe to RSS Feed
- Mark Topic as New
- Mark Topic as Read
- Float this Topic for Current User
- Bookmark
- Subscribe
- Mute
- Printer Friendly Page
- Mark as New
- Bookmark
- Subscribe
- Mute
- Subscribe to RSS Feed
- Permalink
- Report Inappropriate Content
ESXi 5 Multiple hosts crash
Hi,
I experienced a very strange issue this week and I am trying to get to the bottom of it.
At 10:07 we lost pretty much all virtual infrastructure, on our monitoring kit/syslogs etc some events were generated, but as the syslog server was virtual this was pretty much stopped as soon as the issue happened.
I have multiple ESX clusters with one of them having quite recent hardware (IBM Bladecentre with HS23 blades) All 6 hosts in this cluster had PSOD. Obviously all guest VMs where unavailable also.
The guys onsite eventually figured out what was happening and bounced all the servers. I was out on a customer site so did not investigate until well after the event. the guys who saw the PSOD both tell me that the PSOD mentioned something about a log being full. I have checked out the dump log and cant find any reference to this.
Here is the crash log around the event,
2012-10-16T09:07:18.364Z cpu24:4120)0x412200607858:[0x418023a9b0ec]Util_Udelay@vmkernel#nover+0x2f stack: 0x412200010000
2012-10-16T09:07:18.365Z cpu24:4120)0x4122006078a8:[0x418024045a56]_be_mpu_post_wrb_ring@<None>#<None>+0xed stack: 0x4122ffffffff
2012-10-16T09:07:18.365Z cpu24:4120)0x412200607908:[0x4180240428e9]be_function_post_mcc_wrb@<None>#<None>+0x128 stack: 0x0
2012-10-16T09:07:18.365Z cpu24:4120)0x412200607998:[0x418024043aaf]be_eq_modify_delay@<None>#<None>+0x156 stack: 0x0
2012-10-16T09:07:18.366Z cpu24:4120)0x412200607ad8:[0x418024039efd]rate_timer_func@<None>#<None>+0x360 stack: 0x0
2012-10-16T09:07:18.366Z cpu24:4120)0x412200607b78:[0x418023a96e12]Timer_BHHandler@vmkernel#nover+0x225 stack: 0xfffc01000000df
2012-10-16T09:07:18.367Z cpu24:4120)0x412200607bb8:[0x418023a1890d]BH_Check@vmkernel#nover+0x80 stack: 0x4122ffffffff
2012-10-16T09:07:18.367Z cpu24:4120)0x412200607bf8:[0x418023a4221d]IDT_HandleInterrupt@vmkernel#nover+0x13c stack: 0x418046000140
2012-10-16T09:07:18.368Z cpu24:4120)0x412200607c18:[0x418023a42a7d]IDT_IntrHandler@vmkernel#nover+0xa4 stack: 0x412200607d28
2012-10-16T09:07:18.368Z cpu24:4120)0x412200607c28:[0x418023af2047]gate_entry@vmkernel#nover+0x46 stack: 0x4018
2012-10-16T09:07:18.368Z cpu24:4120)0x412200607d28:[0x418023d00281]Power_HaltPCPU@vmkernel#nover+0x274 stack: 0x206a8148a83722
2012-10-16T09:07:18.369Z cpu24:4120)0x412200607e58:[0x418023bf05fa]CpuSchedIdleLoopInt@vmkernel#nover+0xb3d stack: 0x412200607e98
2012-10-16T09:07:18.369Z cpu24:4120)0x412200607e68:[0x418023bf75f6]CpuSched_IdleLoop@vmkernel#nover+0x15 stack: 0x28
2012-10-16T09:07:18.370Z cpu24:4120)0x412200607e98:[0x418023a4631e]Init_SlaveIdle@vmkernel#nover+0x13d stack: 0x0
2012-10-16T09:07:18.370Z cpu24:4120)0x412200607fe8:[0x418023d06479]SMPSlaveIdle@vmkernel#nover+0x310 stack: 0x0
[31;1m2012-10-16T09:07:21.363Z cpu20:3901569)ALERT: Heartbeat: 618: PCPU 13 didn't have a heartbeat for 8 seconds. *may* be locked up[0m
[31;1m2012-10-16T09:07:21.363Z cpu13:4134)ALERT: NMI: 1943: NMI IPI received. Was eip(base):ebp:cs [0x3023e6(0x418023a00000):0x412200987f10:0x4010](Src 0x1, CPU13)[0m
2012-10-16T09:07:21.364Z cpu13:4134)0x412200987f10:[0x418023d023e6]PowerSetPStateAnyPCPU@vmkernel#nover+0xf9 stack: 0x18
2012-10-16T09:07:21.365Z cpu13:4134)0x412200987f40:[0x418023d51b88]VMKAcpiStateNotifyHandler@vmkernel#nover+0xcb stack: 0x0
2012-10-16T09:07:21.365Z cpu13:4134)0x412200987f60:[0x418023d1a028]AcpiEvNotifyDispatch@vmkernel#nover+0x63 stack: 0x0
2012-10-16T09:07:21.365Z cpu13:4134)0x412200987ff0:[0x418023a3e2ef]helpFunc@vmkernel#nover+0x54e stack: 0x0
2012-10-16T09:07:21.366Z cpu13:4134)0x412200987ff8:[0x0]<unknown> stack: 0x0
[31;1m2012-10-16T09:07:27.363Z cpu4:4523330)ALERT: Heartbeat: 618: PCPU 18 didn't have a heartbeat for 8 seconds. *may* be locked up[0m
[31;1m2012-10-16T09:07:27.363Z cpu18:4155)ALERT: NMI: 1943: NMI IPI received. Was eip(base):ebp:cs [0x4c04da(0x418023a00000):0x412200ec7dd0:0x4010](Src 0x1, CPU18)[0m
2012-10-16T09:07:27.364Z cpu18:4155)0x412200ec7dd0:[0x418023ec04da]__raw_spin_failed@com.vmware.driverAPI#9.2+0x1 stack: 0x410000000001
2012-10-16T09:07:27.365Z cpu18:4155)0x412200ec7e10:[0x41802403c52d]be_get_stats@<None>#<None>+0x94 stack: 0x410005aa0000
2012-10-16T09:07:27.365Z cpu18:4155)0x412200ec7e30:[0x41802403ca88]benet_get_stats@<None>#<None>+0x63 stack: 0x412200ec7e80
2012-10-16T09:07:27.365Z cpu18:4155)0x412200ec7f20:[0x418023ecc1f5]GetDeviceStats@com.vmware.driverAPI#9.2+0x50 stack: 0x410009239168
2012-10-16T09:07:27.366Z cpu18:4155)0x412200ec7f60:[0x418023b85c2b]UplinkAsyncProcessCallsHelperCB@vmkernel#nover+0x122 stack: 0x0
2012-10-16T09:07:27.366Z cpu18:4155)0x412200ec7ff0:[0x418023a3e2ef]helpFunc@vmkernel#nover+0x54e stack: 0x0
2012-10-16T09:07:27.367Z cpu18:4155)0x412200ec7ff8:[0x0]<unknown> stack: 0x0
[31;1m2012-10-16T09:07:32.363Z cpu28:4124)ALERT: Heartbeat: 618: PCPU 24 didn't have a heartbeat for 21 seconds. *may* be locked up[0m
[31;1m2012-10-16T09:07:32.363Z cpu24:4120)ALERT: NMI: 1915: NMI IPI recvd. We Halt. eip(base):ebp:cs [0x9b0ec(0x418023a00000):0x412200607858:0x4010](Src0x1, CPU24)[0m
2012-10-16T09:07:32.363Z cpu28:4124)World: 7145: PRDA 0x418047000000 ss 0x0 ds 0x4018 es 0x4018 fs 0x4018 gs 0x4018
2012-10-16T09:07:32.363Z cpu28:4124)World: 7147: TR 0x110 GDT 0x41220071f000 (0x401f) IDT 0x418023af4000 (0xfff)
2012-10-16T09:07:32.403Z cpu28:4124)Panic: 835: Saved backtrace: pcpu 24 Heartbeat NMI
2012-10-16T09:07:32.404Z cpu28:4124)pcpu 24 Heartbeat NMI: 0x412200607858:[0x418023a9b0ec]Util_Udelay@vmkernel#nover+0x2f stack: 0x4122
2012-10-16T09:07:32.404Z cpu28:4124)pcpu 24 Heartbeat NMI: 0x4122006078a8:[0x418024045a56]_be_mpu_post_wrb_ring@<None>#<None>+0xed stac
2012-10-16T09:07:32.405Z cpu28:4124)pcpu 24 Heartbeat NMI: 0x412200607908:[0x4180240428e9]be_function_post_mcc_wrb@<None>#<None>+0x128
2012-10-16T09:07:32.405Z cpu28:4124)pcpu 24 Heartbeat NMI: 0x412200607998:[0x418024043aaf]be_eq_modify_delay@<None>#<None>+0x156 stack:
2012-10-16T09:07:32.406Z cpu28:4124)pcpu 24 Heartbeat NMI: 0x412200607ad8:[0x418024039efd]rate_timer_func@<None>#<None>+0x360 stack: 0x
2012-10-16T09:07:32.406Z cpu28:4124)pcpu 24 Heartbeat NMI: 0x412200607b78:[0x418023a96e12]Timer_BHHandler@vmkernel#nover+0x225 stack: 0
2012-10-16T09:07:32.407Z cpu28:4124)pcpu 24 Heartbeat NMI: 0x412200607bb8:[0x418023a1890d]BH_Check@vmkernel#nover+0x80 stack: 0x4122fff
2012-10-16T09:07:32.407Z cpu28:4124)pcpu 24 Heartbeat NMI: 0x412200607bf8:[0x418023a4221d]IDT_HandleInterrupt@vmkernel#nover+0x13c stac
2012-10-16T09:07:32.408Z cpu28:4124)pcpu 24 Heartbeat NMI: 0x412200607c18:[0x418023a42a7d]IDT_IntrHandler@vmkernel#nover+0xa4 stack: 0x
2012-10-16T09:07:32.408Z cpu28:4124)pcpu 24 Heartbeat NMI: 0x412200607c28:[0x418023af2047]gate_entry@vmkernel#nover+0x46 stack: 0x4018,
2012-10-16T09:07:32.409Z cpu28:4124)pcpu 24 Heartbeat NMI: 0x412200607d28:[0x418023d00281]Power_HaltPCPU@vmkernel#nover+0x274 stack: 0x
2012-10-16T09:07:32.409Z cpu28:4124)pcpu 24 Heartbeat NMI: 0x412200607e58:[0x418023bf05fa]CpuSchedIdleLoopInt@vmkernel#nover+0xb3d stac
2012-10-16T09:07:32.410Z cpu28:4124)pcpu 24 Heartbeat NMI: 0x412200607e68:[0x418023bf75f6]CpuSched_IdleLoop@vmkernel#nover+0x15 stack:
2012-10-16T09:07:32.410Z cpu28:4124)pcpu 24 Heartbeat NMI: 0x412200607e98:[0x418023a4631e]Init_SlaveIdle@vmkernel#nover+0x13d stack: 0x
2012-10-16T09:07:32.411Z cpu28:4124)pcpu 24 Heartbeat NMI: 0x412200607fe8:[0x418023d06479]SMPSlaveIdle@vmkernel#nover+0x310 stack: 0x0,
2012-10-16T09:07:32.429Z cpu28:4124)[45m[33;1mVMware ESXi 5.0.0 [Releasebuild-768111 x86_64][0m
PCPU 24: no heartbeat (but 2/2 IPIs received).
2012-10-16T09:07:32.429Z cpu28:4124)cr0=0x80010039 cr2=0x0 cr3=0x10d000 cr4=0x216c
2012-10-16T09:07:32.429Z cpu28:4124)pcpu:0 world:2841010 name:"vmm1:flc-rds03.domain.co.uk" (V)
2012-10-16T09:07:32.429Z cpu28:4124)pcpu:1 world:4097 name:"idle1" (IS)
2012-10-16T09:07:32.429Z cpu28:4124)pcpu:2 world:1744551 name:"vmm0:server06.domain.local" (V)
2012-10-16T09:07:32.429Z cpu28:4124)pcpu:3 world:4165861 name:"vmx" (U)
2012-10-16T09:07:32.429Z cpu28:4124)pcpu:4 world:3244326 name:"vmm1:dc01-scott.scottmail.co.uk-VSS" (V)
2012-10-16T09:07:32.429Z cpu28:4124)pcpu:5 world:4101 name:"idle5" (IS)
2012-10-16T09:07:32.429Z cpu28:4124)pcpu:6 world:3244324 name:"vmm0:dc01-scott.scottmail.co.uk-VSS" (V)
2012-10-16T09:07:32.429Z cpu28:4124)pcpu:7 world:4523330 name:"vmm0:fli-ips02.domain.local" (V)
2012-10-16T09:07:32.429Z cpu28:4124)pcpu:8 world:3842033 name:"vmm1:server03.domain.co.uk" (V)
2012-10-16T09:07:32.429Z cpu28:4124)pcpu:9 world:4105 name:"idle9" (IS)
2012-10-16T09:07:32.429Z cpu28:4124)pcpu:10 world:2841008 name:"vmm0:flc-rds03.domain.co.uk" (V)
2012-10-16T09:07:32.429Z cpu28:4124)pcpu:11 world:3907678 name:"vmm0:flc-lync01.domain.co.uk-VSS" (V)
2012-10-16T09:07:32.429Z cpu28:4124)pcpu:12 world:3846127 name:"vmm0:server03.domain.co.uk" (V)
2012-10-16T09:07:32.429Z cpu28:4124)pcpu:13 world:4134 name:"helper0-0" (SH)
2012-10-16T09:07:32.429Z cpu28:4124)pcpu:14 world:3265111 name:"vmm0:fls-cog02.domain.co.uk" (V)
2012-10-16T09:07:32.429Z cpu28:4124)pcpu:15 world:3899488 name:"vmm1:flc-lync01.domain.co.uk-VSS" (V)
2012-10-16T09:07:32.429Z cpu28:4124)pcpu:16 world:4112 name:"idle16" (IS)
2012-10-16T09:07:32.429Z cpu28:4124)pcpu:17 world:4113 name:"idle17" (IS)
2012-10-16T09:07:32.429Z cpu28:4124)pcpu:18 world:4155 name:"helper12-0" (SH)
2012-10-16T09:07:32.429Z cpu28:4124)pcpu:19 world:4115 name:"idle19" (IS)
2012-10-16T09:07:32.429Z cpu28:4124)pcpu:20 world:4116 name:"idle20" (IS)
2012-10-16T09:07:32.429Z cpu28:4124)pcpu:21 world:4117 name:"idle21" (IS)
2012-10-16T09:07:32.429Z cpu28:4124)pcpu:22 world:4118 name:"idle22" (IS)
2012-10-16T09:07:32.429Z cpu28:4124)pcpu:23 world:4119 name:"idle23" (IS)
2012-10-16T09:07:32.429Z cpu28:4124)pcpu:24 world:4120 name:"idle24" (IS)
2012-10-16T09:07:32.429Z cpu28:4124)pcpu:25 world:4121 name:"idle25" (IS)
2012-10-16T09:07:32.429Z cpu28:4124)pcpu:26 world:3901569 name:"vmm0:Webserver03.domain.co.uk-VSS" (V)
2012-10-16T09:07:32.429Z cpu28:4124)pcpu:27 world:4123 name:"idle27" (IS)
2012-10-16T09:07:32.429Z cpu28:4124)pcpu:28 world:4124 name:"idle28" (IS)
2012-10-16T09:07:32.429Z cpu28:4124)pcpu:29 world:4125 name:"idle29" (IS)
2012-10-16T09:07:32.429Z cpu28:4124)pcpu:30 world:4126 name:"idle30" (IS)
2012-10-16T09:07:32.429Z cpu28:4124)pcpu:31 world:4127 name:"idle31" (IS)
2012-10-16T09:07:32.429Z cpu28:4124)@BlueScreen: PCPU 24: no heartbeat (but 2/2 IPIs received).
2012-10-16T09:07:32.429Z cpu28:4124)Code start: 0x418023a00000 VMK uptime: 52:19:16:13.591
2012-10-16T09:07:32.430Z cpu28:4124)Saved backtrace from: pcpu 24 Heartbeat NMI
2012-10-16T09:07:32.430Z cpu28:4124)0x412200607858:[0x418023a9b0ec]Util_Udelay@vmkernel#nover+0x2f stack: 0x412200010000
2012-10-16T09:07:32.431Z cpu28:4124)0x4122006078a8:[0x418024045a56]_be_mpu_post_wrb_ring@<None>#<None>+0xed stack: 0x4122ffffffff
2012-10-16T09:07:32.432Z cpu28:4124)0x412200607908:[0x4180240428e9]be_function_post_mcc_wrb@<None>#<None>+0x128 stack: 0x0
2012-10-16T09:07:32.433Z cpu28:4124)0x412200607998:[0x418024043aaf]be_eq_modify_delay@<None>#<None>+0x156 stack: 0x0
2012-10-16T09:07:32.434Z cpu28:4124)0x412200607ad8:[0x418024039efd]rate_timer_func@<None>#<None>+0x360 stack: 0x0
2012-10-16T09:07:32.434Z cpu28:4124)0x412200607b78:[0x418023a96e12]Timer_BHHandler@vmkernel#nover+0x225 stack: 0xfffc01000000df
2012-10-16T09:07:32.435Z cpu28:4124)0x412200607bb8:[0x418023a1890d]BH_Check@vmkernel#nover+0x80 stack: 0x4122ffffffff
2012-10-16T09:07:32.436Z cpu28:4124)0x412200607bf8:[0x418023a4221d]IDT_HandleInterrupt@vmkernel#nover+0x13c stack: 0x418046000140
2012-10-16T09:07:32.437Z cpu28:4124)0x412200607c18:[0x418023a42a7d]IDT_IntrHandler@vmkernel#nover+0xa4 stack: 0x412200607d28
2012-10-16T09:07:32.438Z cpu28:4124)0x412200607c28:[0x418023af2047]gate_entry@vmkernel#nover+0x46 stack: 0x4018
2012-10-16T09:07:32.438Z cpu28:4124)0x412200607d28:[0x418023d00281]Power_HaltPCPU@vmkernel#nover+0x274 stack: 0x206a8148a83722
2012-10-16T09:07:32.439Z cpu28:4124)0x412200607e58:[0x418023bf05fa]CpuSchedIdleLoopInt@vmkernel#nover+0xb3d stack: 0x412200607e98
2012-10-16T09:07:32.440Z cpu28:4124)0x412200607e68:[0x418023bf75f6]CpuSched_IdleLoop@vmkernel#nover+0x15 stack: 0x28
2012-10-16T09:07:32.441Z cpu28:4124)0x412200607e98:[0x418023a4631e]Init_SlaveIdle@vmkernel#nover+0x13d stack: 0x0
2012-10-16T09:07:32.442Z cpu28:4124)0x412200607fe8:[0x418023d06479]SMPSlaveIdle@vmkernel#nover+0x310 stack: 0x0
2012-10-16T09:07:32.450Z cpu28:4124)base fs=0x0 gs=0x418047000000 Kgs=0x0
2012-10-01T18:17:33.919Z cpu5:4965)ScsiDeviceIO: 3081: Failed write command to write-quiesced partition naa.60050768028104d2200000000000000e:1
2012-10-16T09:07:32.363Z cpu28:4124)Heartbeat: 618: PCPU 24 didn't have a heartbeat for 21 seconds. *may* be locked up
2012-10-16T09:07:27.363Z cpu18:4155)NMI: 1943: NMI IPI received. Was eip(base):ebp:cs [0x4c04da(0x418023a00000):0x412200ec7dd0:0x4010](Src 0x1, CPU18)
2012-10-16T09:07:27.363Z cpu4:4523330)Heartbeat: 618: PCPU 18 didn't have a heartbeat for 8 seconds. *may* be locked up
2012-10-16T09:07:21.363Z cpu13:4134)NMI: 1943: NMI IPI received. Was eip(base):ebp:cs [0x3023e6(0x418023a00000):0x412200987f10:0x4010](Src 0x1, CPU13)
2012-10-16T09:07:21.363Z cpu20:3901569)Heartbeat: 618: PCPU 13 didn't have a heartbeat for 8 seconds. *may* be locked up
2012-10-16T09:07:18.363Z cpu24:4120)NMI: 1943: NMI IPI received. Was eip(base):ebp:cs [0x9b0ec(0x418023a00000):0x412200607858:0x4010](Src 0x1, CPU24)
2012-10-16T09:07:32.453Z cpu28:4124)Backtrace for current CPU #28, worldID=4124, ebp=0x412200707a68
2012-10-16T09:07:32.454Z cpu28:4124)0x412200707a68:[0x418023a6d0c8]Panic_WithBacktrace@vmkernel#nover+0xa3 stack: 0x412200707ad8, 0x9a0
2012-10-16T09:07:32.454Z cpu28:4124)0x412200707ad8:[0x418023cd9bd7]Heartbeat_DetectCPULockups@vmkernel#nover+0x2be stack: 0x0, 0x410005
2012-10-16T09:07:32.455Z cpu28:4124)0x412200707b78:[0x418023a96df7]Timer_BHHandler@vmkernel#nover+0x20a stack: 0xfffc01000000df, 0xdf,
2012-10-16T09:07:32.455Z cpu28:4124)0x412200707bb8:[0x418023a1890d]BH_Check@vmkernel#nover+0x80 stack: 0x4122ffffffff, 0x412200707cc0,
2012-10-16T09:07:32.456Z cpu28:4124)0x412200707bf8:[0x418023a4221d]IDT_HandleInterrupt@vmkernel#nover+0x13c stack: 0x418047000140, 0x0,
2012-10-16T09:07:32.456Z cpu28:4124)0x412200707c18:[0x418023a42a7d]IDT_IntrHandler@vmkernel#nover+0xa4 stack: 0x412200707d28, 0x418023d
2012-10-16T09:07:32.457Z cpu28:4124)0x412200707c28:[0x418023af2047]gate_entry@vmkernel#nover+0x46 stack: 0x4018, 0x4018, 0x0, 0x0, 0x0
2012-10-16T09:07:32.457Z cpu28:4124)0x412200707d28:[0x418023d00281]Power_HaltPCPU@vmkernel#nover+0x274 stack: 0x206a8b6ea74972, 0x206a8
2012-10-16T09:07:32.458Z cpu28:4124)0x412200707e58:[0x418023bf05fa]CpuSchedIdleLoopInt@vmkernel#nover+0xb3d stack: 0x412200707e98, 0x41
2012-10-16T09:07:32.458Z cpu28:4124)0x412200707e68:[0x418023bf75f6]CpuSched_IdleLoop@vmkernel#nover+0x15 stack: 0x2c, 0x1c, 0x0, 0x2c,
2012-10-16T09:07:32.459Z cpu28:4124)0x412200707e98:[0x418023a4631e]Init_SlaveIdle@vmkernel#nover+0x13d stack: 0x0, 0x200000000, 0x0, 0x
2012-10-16T09:07:32.459Z cpu28:4124)0x412200707fe8:[0x418023d06479]SMPSlaveIdle@vmkernel#nover+0x310 stack: 0x0, 0x0, 0x0, 0x0, 0x0
2012-10-16T09:07:32.459Z cpu28:4124)vmkernel 0x0 .data 0x0 .bss 0x0
2012-10-16T09:07:32.459Z cpu28:4124)procfs 0x418023e9b000 .data 0x417fe3efc000 .bss 0x417fe3efc220
2012-10-16T09:07:32.459Z cpu28:4124)vmkplexer 0x418023e9e000 .data 0x417fe3efd040 .bss 0x417fe3efd4e0
2012-10-16T09:07:32.459Z cpu28:4124)vmklinux_9 0x418023ea2000 .data 0x417fe3eff080 .bss 0x417fe3f0d340
2012-10-16T09:07:32.459Z cpu28:4124)vmklinux_9_2_0_0 0x418023f15000 .data 0x417fe3f120c0 .bss 0x417fe3f1c868
2012-10-16T09:07:32.459Z cpu28:4124)tpm_tis 0x418023f16000 .data 0x417fe3f1d0e0 .bss 0x417fe3f1d300
2012-10-16T09:07:32.459Z cpu28:4124)random 0x418023f19000 .data 0x417fe3f1e140 .bss 0x417fe3f1e880
2012-10-16T09:07:32.459Z cpu28:4124)usb 0x418023f1d000 .data 0x417fe3f22160 .bss 0x417fe3f24100
2012-10-16T09:07:32.459Z cpu28:4124)ehci-hcd 0x418023f3a000 .data 0x417fe3f251a0 .bss 0x417fe3f256a0
2012-10-16T09:07:32.459Z cpu28:4124)hid 0x418023f44000 .data 0x417fe3f261c0 .bss 0x417fe3f267c0
2012-10-16T09:07:32.459Z cpu28:4124)dm 0x418023f49000 .data 0x417fe3f27200 .bss 0x417fe3f27200
2012-10-16T09:07:32.459Z cpu28:4124)nmp 0x418023f4b000 .data 0x417fe3f28240 .bss 0x417fe3f2bd20
2012-10-16T09:07:32.459Z cpu28:4124)vmw_satp_local 0x418023f6b000 .data 0x417fe3f2c260 .bss 0x417fe3f2c2b0
2012-10-16T09:07:32.459Z cpu28:4124)vmw_satp_default_aa 0x418023f6d000 .data 0x417fe3f2d270 .bss 0x417fe3f2d270
2012-10-16T09:07:32.459Z cpu28:4124)vmw_psp_lib 0x418023f6e000 .data 0x417fe3f2e280 .bss 0x417fe3f2e610
2012-10-16T09:07:32.459Z cpu28:4124)vmw_psp_fixed 0x418023f70000 .data 0x417fe3f2f290 .bss 0x417fe3f2f290
2012-10-16T09:07:32.459Z cpu28:4124)vmw_psp_rr 0x418023f72000 .data 0x417fe3f302a0 .bss 0x417fe3f30330
2012-10-16T09:07:32.459Z cpu28:4124)vmw_psp_mru 0x418023f75000 .data 0x417fe3f312b0 .bss 0x417fe3f312b0
2012-10-16T09:07:32.459Z cpu28:4124)libata 0x418023f77000 .data 0x417fe3f322c0 .bss 0x417fe3f35ba0
2012-10-16T09:07:32.459Z cpu28:4124)usb-storage 0x418023f96000 .data 0x417fe3f36300 .bss 0x417fe3f3ac40
2012-10-16T09:07:32.459Z cpu28:4124)vfat 0x418023fa2000 .data 0x417fe3f3c340 .bss 0x417fe3f3e3c0
2012-10-16T09:07:32.459Z cpu28:4124)vprobe 0x418023fab000 .data 0x417fe3f3f380 .bss 0x417fe3f4b200
2012-10-16T09:07:32.459Z cpu28:4124)vmci 0x418023fdc000 .data 0x417fe3f793c0 .bss 0x417fe3f7e380
2012-10-16T09:07:32.459Z cpu28:4124)iscsi_trans 0x418023ffc000 .data 0x417fe3f7f400 .bss 0x417fe3f80820
2012-10-16T09:07:32.459Z cpu28:4124)etherswitch 0x418024007000 .data 0x417fe3f81440 .bss 0x417fe3f91360
2012-10-16T09:07:32.459Z cpu28:4124)netsched 0x41802402a000 .data 0x417fe3f92480 .bss 0x417fe3f95400
2012-10-16T09:07:32.459Z cpu28:4124)cnic_register 0x418024030000 .data 0x417fe3f964c0 .bss 0x417fe3f96760
2012-10-16T09:07:32.459Z cpu28:4124)be2net 0x418024032000 .data 0x417fe3f974e0 .bss 0x417fe3f983c0
2012-10-16T09:07:32.459Z cpu28:4124)usbnet 0x418024055000 .data 0x417fe3f9b520 .bss 0x417fe3f9bbe0
2012-10-16T09:07:32.459Z cpu28:4124)cdc_ether 0x41802405a000 .data 0x417fe3f9c540 .bss 0x417fe3f9c8e0
2012-10-16T09:07:32.459Z cpu28:4124)iscsi_linux 0x41802405c000 .data 0x417fe3f9d580 .bss 0x417fe3f9e040
2012-10-16T09:07:32.459Z cpu28:4124)libfc 0x41802405f000 .data 0x417fe3f9e5a0 .bss 0x417fe3f9f560
2012-10-16T09:07:32.459Z cpu28:4124)libfcoe 0x418024079000 .data 0x417fe3fa05e0 .bss 0x417fe3fa0900
2012-10-16T09:07:32.459Z cpu28:4124)mpt2sas 0x41802407f000 .data 0x417fe3fa1600 .bss 0x417fe3fa2760
2012-10-16T09:07:32.459Z cpu28:4124)lpfc820 0x4180240a8000 .data 0x417fe3fa3640 .bss 0x417fe3fb2d80
2012-10-16T09:07:32.459Z cpu28:4124)lvmdriver 0x418024165000 .data 0x417fe3fb3680 .bss 0x417fe3fb6480
2012-10-16T09:07:32.459Z cpu28:4124)deltadisk 0x418024179000 .data 0x417fe3fb86c0 .bss 0x417fe3fbbac0
2012-10-16T09:07:32.459Z cpu28:4124)multiextent 0x418024195000 .data 0x417fe3fbc700 .bss 0x417fe3fbc780
2012-10-16T09:07:32.459Z cpu28:4124)vmw_satp_svc 0x418024197000 .data 0x417fe3fbd710 .bss 0x417fe3fbd718
2012-10-16T09:07:32.459Z cpu28:4124)heartbeat 0x418024199000 .data 0x417fe3fbe740 .bss 0x417fe3fcd400
2012-10-16T09:07:32.459Z cpu28:4124)shaper 0x4180241a9000 .data 0x417fe3fcd780 .bss 0x417fe3fd1400
2012-10-16T09:07:32.460Z cpu28:4124)cdp 0x4180241af000 .data 0x417fe3fd17c0 .bss 0x417fe3fe1280
2012-10-16T09:07:32.460Z cpu28:4124)ipfix 0x4180241c2000 .data 0x417fe3fe1800 .bss 0x417fe3fefd00
2012-10-16T09:07:32.460Z cpu28:4124)fence_overlay 0x4180241d1000 .data 0x417fe3ff0840 .bss 0x417fe3ff0c50
2012-10-16T09:07:32.460Z cpu28:4124)tcpip3 0x4180241da000 .data 0x417fe3ff1880 .bss 0x417fe3ff9fe0
2012-10-16T09:07:32.460Z cpu28:4124)dvsdev 0x418024289000 .data 0x417fe400e8c0 .bss 0x417fe400e900
2012-10-16T09:07:32.460Z cpu28:4124)dvfilter 0x41802428c000 .data 0x417fe400f900 .bss 0x417fe4010800
2012-10-16T09:07:32.460Z cpu28:4124)esxfw 0x41802429e000 .data 0x417fe4011940 .bss 0x417fe4020d00
2012-10-16T09:07:32.460Z cpu28:4124)vmkapei 0x4180242b0000 .data 0x417fe4021980 .bss 0x417fe4021ae0
2012-10-16T09:07:32.460Z cpu28:4124)vmkibft 0x4180242b5000 .data 0x417fe40229a0 .bss 0x417fe4025be0
2012-10-16T09:07:32.460Z cpu28:4124)vmfs3 0x4180242b8000 .data 0x417fe4026a00 .bss 0x417fe4027560
2012-10-16T09:07:32.460Z cpu28:4124)nfsclient 0x418024305000 .data 0x417fe4028a40 .bss 0x417fe402c100
2012-10-16T09:07:32.460Z cpu28:4124)ipmi_msghandler 0x418024321000 .data 0x417fe402ca80 .bss 0x417fe402d260
2012-10-16T09:07:32.460Z cpu28:4124)ipmi_si_drv 0x41802432a000 .data 0x417fe402daa0 .bss 0x417fe402e360
2012-10-16T09:07:32.460Z cpu28:4124)ipmi_devintf 0x418024334000 .data 0x417fe402eae0 .bss 0x417fe402eda0
2012-10-16T09:07:32.460Z cpu28:4124)vmkstatelogger 0x418024337000 .data 0x417fe402fb00 .bss 0x417fe4032fe0
2012-10-16T09:07:32.460Z cpu28:4124)migrate 0x418024354000 .data 0x417fe4033b40 .bss 0x417fe40387e0
2012-10-16T09:07:32.460Z cpu28:4124)cbt 0x41802439e000 .data 0x417fe4039b80 .bss 0x417fe4039c00
2012-10-16T09:07:32.460Z cpu28:4124)svmmirror 0x4180243a0000 .data 0x417fe403abc0 .bss 0x417fe403ac40
2012-10-16T09:07:32.460Z cpu28:4124)hbr_filter 0x4180243a4000 .data 0x417fe403bc00 .bss 0x417fe403bd40
2012-10-16T09:07:32.460Z cpu28:4124)vmw_satp_lsi 0x4180243c1000 .data 0x417fe4040c40 .bss 0x417fe4040dc8
Coredump to disk.
I have raised an incident with support who have come back to me saying that its probably donw to the Be2Net driver (Emulex 10GbE NIC)
I am not disagreeing with them, but find it a little suspicous that a driver could cause 6 servers to all crash at the exact same moment and also in the dump log i see PCPU errors, so how could the physical CPU affect the NIC?
The servers were installed using the IBM version of ESXi5 and they are patched to 768111 (At the time, been brought to 821926 now) all other hosts in the same bladecentre (HS22's) did not have any issue.
Any thoughts please?
Andy
- Mark as New
- Bookmark
- Subscribe
- Mute
- Subscribe to RSS Feed
- Permalink
- Report Inappropriate Content
yeah - I would like to second that a driver issue could not have all the hosts to panic at once -- I assume all these blades were part of the same chassis? then - I would like to suggests we check the chassis logs ..
HTH
~Sai Garimella
- Mark as New
- Bookmark
- Subscribe
- Mute
- Subscribe to RSS Feed
- Permalink
- Report Inappropriate Content
There is nothing in the chassis logs, the bladecenter never had any issue detected/notified.
We did notice some loop back detection on other nodes of the network around the same time, but these were isolated by BPDU guard, but i am not sure if those were the sympton or the cause.
- Mark as New
- Bookmark
- Subscribe
- Mute
- Subscribe to RSS Feed
- Permalink
- Report Inappropriate Content
Any further thoughts on this?
- Mark as New
- Bookmark
- Subscribe
- Mute
- Subscribe to RSS Feed
- Permalink
- Report Inappropriate Content
can you check aam logs ...to see if the hosts actually got isolated from the network?
~Sai Garimella
- Mark as New
- Bookmark
- Subscribe
- Mute
- Subscribe to RSS Feed
- Permalink
- Report Inappropriate Content
Do you mean the AMM logs of the bladecenter? If so then, there is nothing to suggest any issues on the bladecenter.
- Mark as New
- Bookmark
- Subscribe
- Mute
- Subscribe to RSS Feed
- Permalink
- Report Inappropriate Content
no - the cluster logs on the host -- usually there are in aam*.log files in /var/log/vmware/
- Mark as New
- Bookmark
- Subscribe
- Mute
- Subscribe to RSS Feed
- Permalink
- Report Inappropriate Content
Are these on each host? all logs from the hosts are reset on reboot arent they? I have the crash dump, which does not mention any disconnect.
Is there any logging on the VC?
- Mark as New
- Bookmark
- Subscribe
- Mute
- Subscribe to RSS Feed
- Permalink
- Report Inappropriate Content
Hi all,
I have a similar problem.
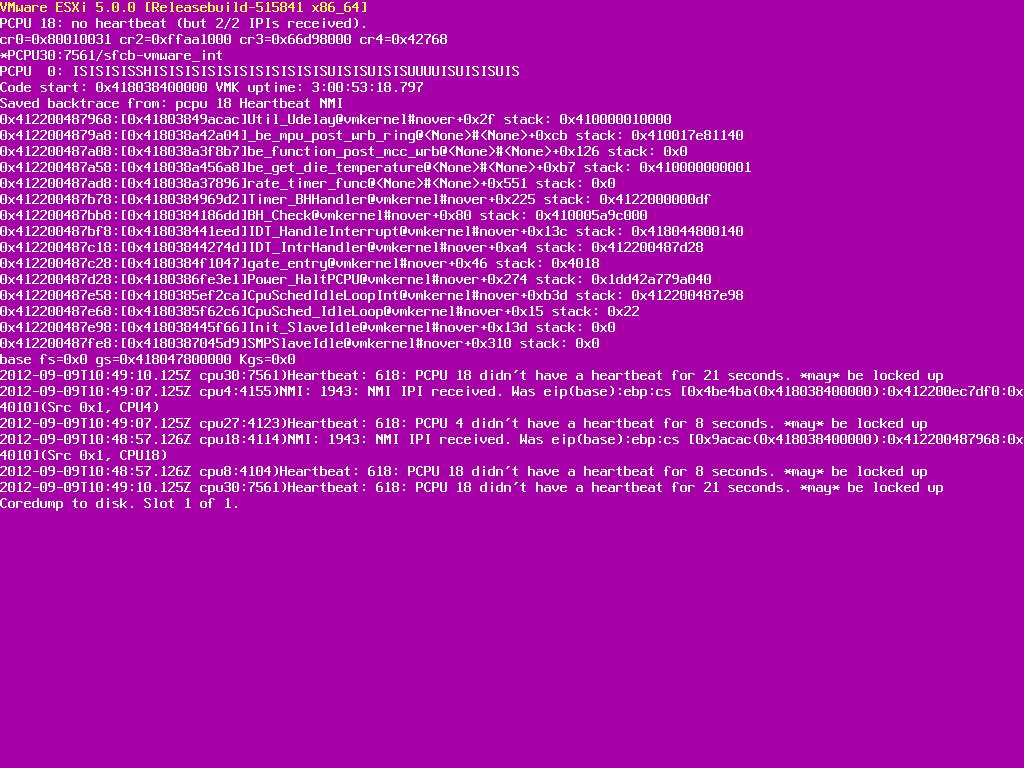
We have ESXi Server with Purple Screen.
The server shows: PCPU 18: no heartbeat (but 2/2 IPIs received).
We install ESXi 5.0.0 RB: 515841 on IBM HS23 Blades.
The firmware is up to date on Balde and Balde Center H.
See screenshots in the appendix.
Does anyone have an idea?
Thanks!
- Mark as New
- Bookmark
- Subscribe
- Mute
- Subscribe to RSS Feed
- Permalink
- Report Inappropriate Content
Hi Kvwm,
See below excerpt from my VMware ticket on this issue. the chap from VMware could not tell me how/why 6 hsots can cause this crash, but he says to update the driver as per below.
2. The PSOD refers to be and benet which I know from experience are related to be2net driver. I am confident the Emulex OneConnect is the root cause.
To prevent a re-occurance upgrade the driver and firmware for the Emulex card
the latest driver can be downloaded here:
https://my.vmware.com/web/vmware/details?downloadGroup=DT-ESX50-EMULEX-be2net-4133448&productId=229
Upgrade the driver as per: http://kb.vmware.com/kb/2005205
Engage the hardware vendor to update to the latest firmware version.
If you have no further questions, I will proceed to archive this case at close of business tomorrow.
Andy
- Mark as New
- Bookmark
- Subscribe
- Mute
- Subscribe to RSS Feed
- Permalink
- Report Inappropriate Content
Hi singy2002,
thanks for the reply.
In the Blade is no 10GE NICs only 1GE NICs.
So I can not use the driver.
So my problem is not solved.
- Mark as New
- Bookmark
- Subscribe
- Mute
- Subscribe to RSS Feed
- Permalink
- Report Inappropriate Content
Actually that was also my thought initially, the NIC assuming you also have the be2net NIC is actually a 10GB NIC but dumbs down to 1GB when connected to a 1GB bladecenter switch.
Run this command on your host - SSH
esxcfg-nics -l
you will see something like:
vmnic2 0000:16:00.04 be2net Up 1000Mbps Full 34:40:b5:e0:46:f2 1500 Emulex Corporation OneConnect 10Gb NIC (be3)
vmnic3 0000:16:00.05 be2net Up 1000Mbps Full 34:40:b5:e0:46:f6 1500 Emulex Corporation OneConnect 10Gb NIC (be3)
See last column with the hardware description
ethtool -i vmnic2 (Change 2 for VMNIC ID)
You will see something like:
~ # ethtool -i vmnic0
driver: be2net
version: 4.1.334.48
firmware-version: 4.1.455.2
bus-info: 0000:16:00.0
If your driver version is 4.1.334.0 then you have the same issue as I did and the NICs are 1
- Mark as New
- Bookmark
- Subscribe
- Mute
- Subscribe to RSS Feed
- Permalink
- Report Inappropriate Content
i will test tomorrow
thank you
- Mark as New
- Bookmark
- Subscribe
- Mute
- Subscribe to RSS Feed
- Permalink
- Report Inappropriate Content
just had something that looks like this issue simultaneously nuke 3 ibm hs22vs (10gb Broadcom Corporation NetXtreme II BCM57711 10 Gigabit Ethernet, bnx2x driver, vsphere build 623860). similar psod. servers chain rebooted for about an hour (a very long hour).
here's the catch... i also run an hp dl360 g7 blade chassis in the same vmware cluster, and two of those hosts also chain-psod'd at about the same time. psod for them was "no hearbeat received".
the hp blades use "Emulex Corporation NC553i 10Gb 2-port FlexFabric Converged Network Adapter"
~ # ethtool -i vmnic0
driver: be2net
version: 4.0.355.1
firmware-version: 4.1.450.7
bus-info: 0000:02:00.0
one common denominator is all these hosts were running citrix xendesktop windows 7 virtual desktops. due to previous crash issues i have a drs rule segragating all the virtual desktop vms onto these 5 hosts (3 ibm 2 hp), with another rule to keep all non-xendesktop machines off. All 5 virtual desktop hosts blew up, none of the virtual desktop hosts did.
the 2 hps might have been coincidence or overload-related when the ibms went down.
- Mark as New
- Bookmark
- Subscribe
- Mute
- Subscribe to RSS Feed
- Permalink
- Report Inappropriate Content
Hi,
i try now the IBM OEM ESXi installation image. (http://www-03.ibm.com/systems/x/os/vmware/esxi/)
In the Image ist the driver: be2net version: 4.1.334.48 inclustive.
Today i install all Host newly with this Image.
(I can use max ESXi 5.0.0 / 515841 compatibility to the Stroage is my problem here )
So i will see if it works (on the Hosts is no production)........ in the past the Host go after three days in pink screen.
- Mark as New
- Bookmark
- Subscribe
- Mute
- Subscribe to RSS Feed
- Permalink
- Report Inappropriate Content
so the ESXi Server run now 5 day without problems.
i think my problem is solved.
thank you.
- Mark as New
- Bookmark
- Subscribe
- Mute
- Subscribe to RSS Feed
- Permalink
- Report Inappropriate Content
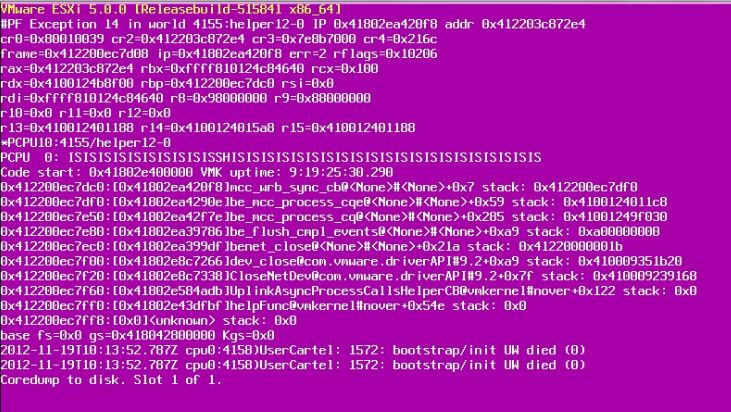
so the problem isn't solved.
after 9 day the esxi server lose their network connection. after a reboot the pink screen was displayed #PF Exception 14 in wold ...... (screenshot in the attachment)
the last thing i have done was install the esxi server IBM OEM ESXi installation image. (http://www-03.ibm.com/systems/x/os/vmware/esxi/)
so i open a ticket at vmware support. they told me i should install this two drivers
(singy2002 has told me the same ![]() in a previous post / an yes in the blades have two 10GE Emulex NICs)
in a previous post / an yes in the blades have two 10GE Emulex NICs)
1)be2net for esx 5.x :
https://my.vmware.com/group/vmware/details?downloadGroup=DT-ESXI50-Emulex-be2net-423270&productId=28...
2)
qlogic
how to:
upgrade the driver as per: http://kb.vmware.com/selfservice/microsites/search.do?language=en_US&cmd=displayKC&externalId=200520...
using vmware update manager
i hope now the problem is solved
- Mark as New
- Bookmark
- Subscribe
- Mute
- Subscribe to RSS Feed
- Permalink
- Report Inappropriate Content
Hi Everyone.
Right now I'm facing the same issue with a slight variation, not all my hosts got a PSOD but all of them got their respective vmnic disconnected, the platform is running on an IBM Bladecenter H, 6 HS23 blades (all of them with the Emulex UCN Adapter) only two switches for the first two onboard ports (the 10Gbps nics are disconnected all the time). But I've updated the be2net driver 5 days ago.
Now, my post goes a little further than the PSOD itself... with the two mentioned ports I've configured the virtual switch to use both ports but in the port group for the VM's I've selected the load balance policy of "Explicit failover" using vmnic2 as Active and vmnic3 as Standby, and the port group for Management network with the opposite configuration (Explicit failover using vmnic3 as active and vmnic2 as standby). In the chassis I have two IBM Server connectivity module each with one single group using the six external ports with LACP enabled. In the other end of the cables we have two cisco switches with an etherchannel configuration (one for one of the IBM SCM an one for the orher) this configuration works like a charm from 6 p.m. (around) until 8 a.m. (sharp) next morning and its unable to become stable until the next 6 p.m. cycle, one other thing is that if we use this configuration without any etherchannel grouping it works fine.
So any thought on this issue will be highly appreciated!
Thanks in advanced!
- Mark as New
- Bookmark
- Subscribe
- Mute
- Subscribe to RSS Feed
- Permalink
- Report Inappropriate Content
Hi Felipunk,
I know everyone says the first.
Do you have the latest firmware for the Emulex UCNA Installs.
What ESXi version you have installed and what patch level??
The latest firmware:
Emulex UCNA firmware update for VMware - 4.2.412.0 - Release IBM1206
Download:
http://www-933.ibm.com/support/fixcentral/systemx/selectFixes?parent=BladeCenter+HS23&product=ibm/sy... Network Adapter
- Mark as New
- Bookmark
- Subscribe
- Mute
- Subscribe to RSS Feed
- Permalink
- Report Inappropriate Content
Hi kvwm.
As for the firmware that is th same version I have installed, in fact I've updated it because of this post. As for the esxi version I'm running 5.0 Update 1 (Build No. 623860).
Thanks for your attention, I'll look forward to any ideas!